Copyright
©2008 The WJG Press and Baishideng.
World J Gastroenterol. Jul 14, 2008; 14(26): 4209-4215
Published online Jul 14, 2008. doi: 10.3748/wjg.14.4209
Published online Jul 14, 2008. doi: 10.3748/wjg.14.4209
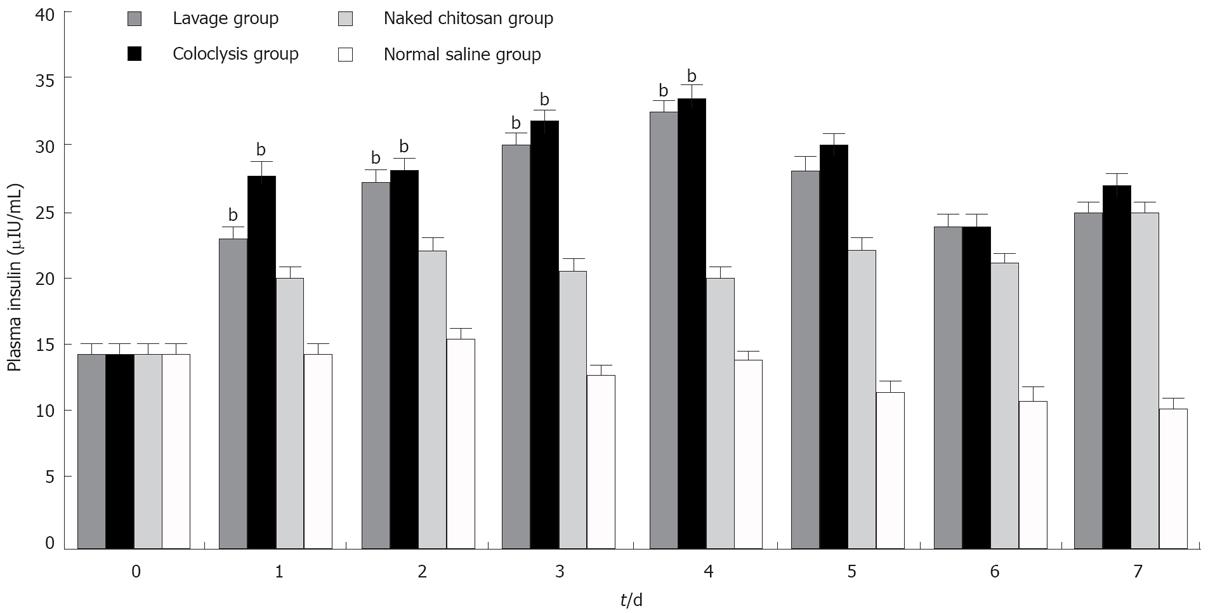
Figure 3 Plasma insulin levels in each group after transfection.
bP < 0.01 vs naked chitosan group and normal saline group (n = 10).
- Citation: Niu L, Xu YC, Dai Z, Tang HQ. Gene therapy for type 1 diabetes mellitus in rats by gastrointestinal administration of chitosan nanoparticles containing human insulin gene. World J Gastroenterol 2008; 14(26): 4209-4215
- URL: https://www.wjgnet.com/1007-9327/full/v14/i26/4209.htm
- DOI: https://dx.doi.org/10.3748/wjg.14.4209


