Copyright
©2008 The WJG Press and Baishideng.
World J Gastroenterol. Jul 7, 2008; 14(25): 4028-4039
Published online Jul 7, 2008. doi: 10.3748/wjg.14.4028
Published online Jul 7, 2008. doi: 10.3748/wjg.14.4028
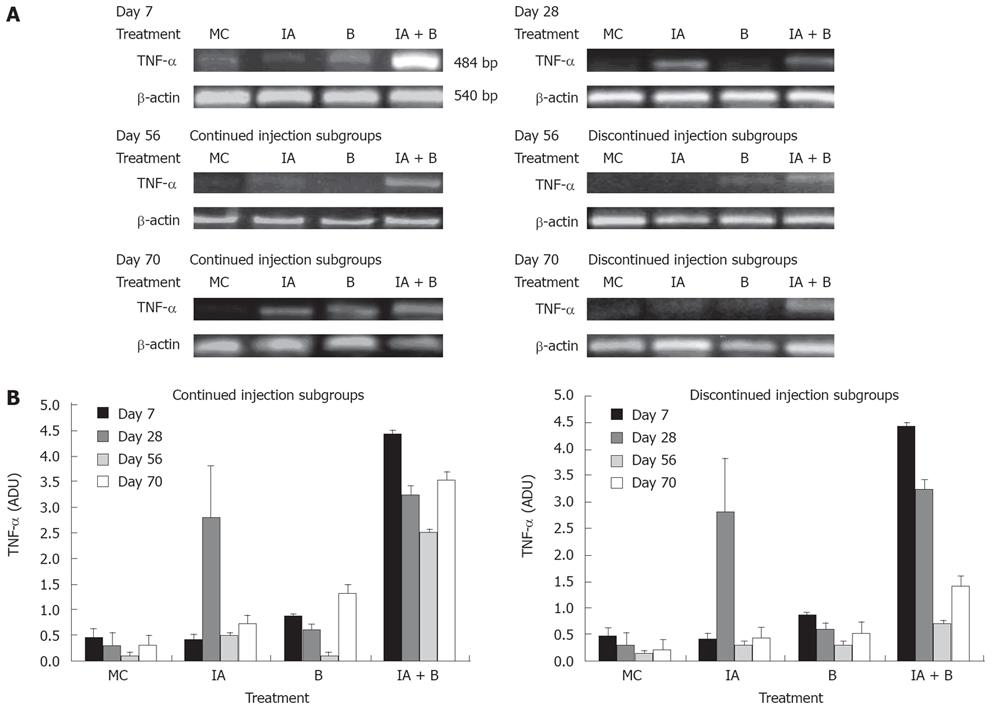
Figure 6 A: Representative photographs from three independent experiments of TNF-α mRNA expression in the descending colon in the various experimental groups at selected time points: day 7, day 28, day 56 continued injection subgroup, day 56 discontinued injection subgroup, day 70 continued injection subgroup, and day 70 discontinued injection subgroup.
Band intensity was adjusted for the corresponding β-actin, and values were expressed as arbitrary density units (ADU); B: Expression of TNF-α mRNA in the descending colon in the various experimental groups both in the continued and discontinued injection subgroups, at all time points. Note the presence of significant difference in expression between the IA + B compared to the other groups (P < 0.005).
- Citation: Hussein IAH, Tohme R, Barada K, Mostafa MH, Freund JN, Jurjus RA, Karam W, Jurjus A. Inflammatory bowel disease in rats: Bacterial and chemical interaction. World J Gastroenterol 2008; 14(25): 4028-4039
- URL: https://www.wjgnet.com/1007-9327/full/v14/i25/4028.htm
- DOI: https://dx.doi.org/10.3748/wjg.14.4028


