Copyright
©2008 The WJG Press and Baishideng.
World J Gastroenterol. Jul 7, 2008; 14(25): 4028-4039
Published online Jul 7, 2008. doi: 10.3748/wjg.14.4028
Published online Jul 7, 2008. doi: 10.3748/wjg.14.4028
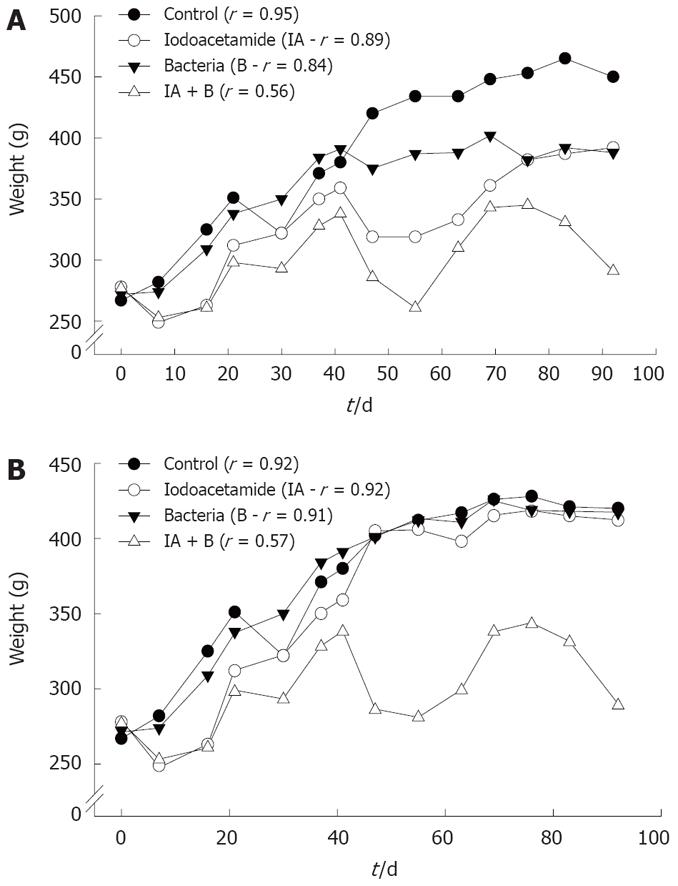
Figure 1 Changes in the average rats' weight in various experimental groups, and in the continued and discontinued treatment subgroups.
A: Continued injection subgroups; B: Discontinued injection subgroups. r: represents the correlation coefficient of weight change vs time. All readings were statistically significant (P < 0.005). Note the slow oscillating rate of increase in the two (IA + B) subgroups and in the continued injection IA subgroup.
- Citation: Hussein IAH, Tohme R, Barada K, Mostafa MH, Freund JN, Jurjus RA, Karam W, Jurjus A. Inflammatory bowel disease in rats: Bacterial and chemical interaction. World J Gastroenterol 2008; 14(25): 4028-4039
- URL: https://www.wjgnet.com/1007-9327/full/v14/i25/4028.htm
- DOI: https://dx.doi.org/10.3748/wjg.14.4028


