Copyright
©2008 The WJG Press and Baishideng.
World J Gastroenterol. Jul 7, 2008; 14(25): 4020-4027
Published online Jul 7, 2008. doi: 10.3748/wjg.14.4020
Published online Jul 7, 2008. doi: 10.3748/wjg.14.4020
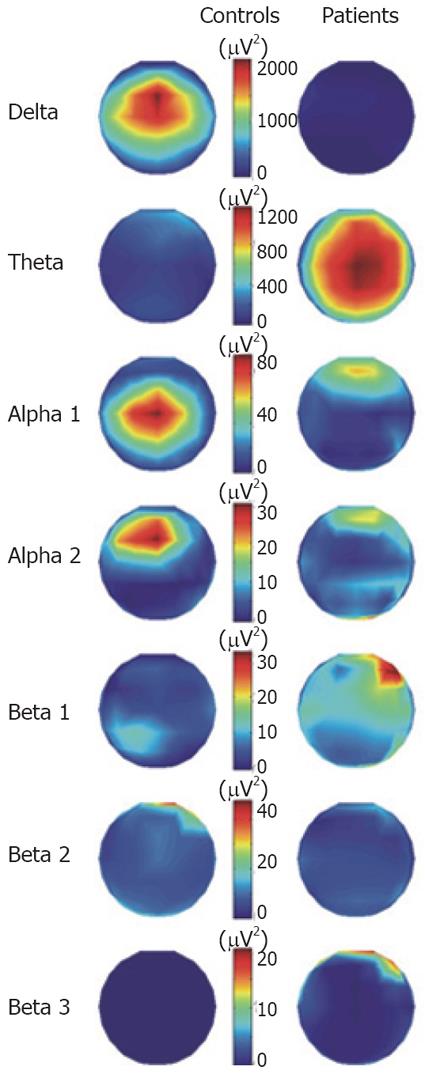
Figure 2 The spatial distribution of energy divided into frequency bands for patients and controls throughout the 450 ms of analysis.
Note that a different color scaling for each frequency band was used.
- Citation: Drewes AM, Gratkowski M, Sami SA, Dimcevski G, Funch-Jensen P, Arendt-Nielsen L. Is the pain in chronic pancreatitis of neuropathic origin? Support from EEG studies during experimental pain. World J Gastroenterol 2008; 14(25): 4020-4027
- URL: https://www.wjgnet.com/1007-9327/full/v14/i25/4020.htm
- DOI: https://dx.doi.org/10.3748/wjg.14.4020


