Copyright
©2008 The WJG Press and Baishideng.
World J Gastroenterol. Jul 7, 2008; 14(25): 3997-4004
Published online Jul 7, 2008. doi: 10.3748/wjg.14.3997
Published online Jul 7, 2008. doi: 10.3748/wjg.14.3997
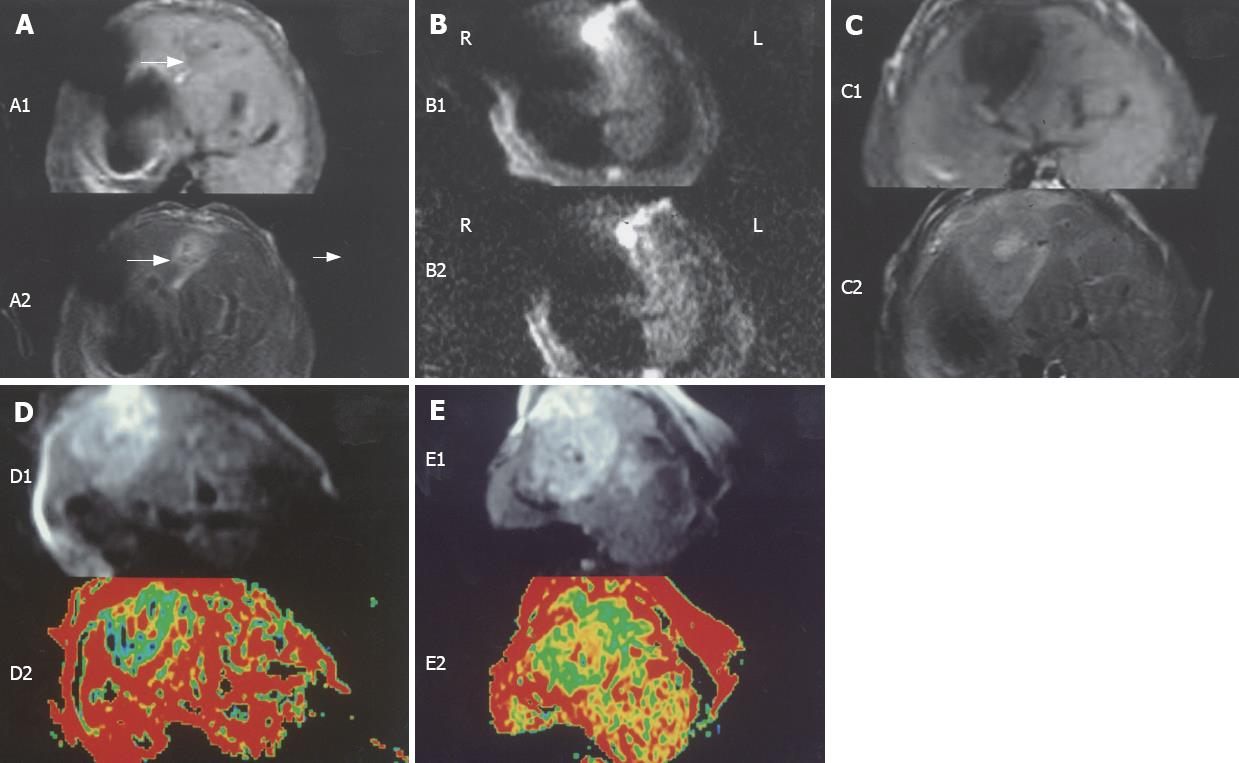
Figure 3 Image manifestations of hepatic VX-2 tumor on DWI, ADC map, T1WI or T2WI.
A: A1, a low signal and obscure margin of VX-2 tumor on T1WI and A2, a slightly high signal on T2WI on the 7th day after implantation; B: a high signal and distinct margin of VX-2 tumor on DWI when b value was 100 (B1) or 300 (B2) s/mm2 and low SNR when b value was 300 (B2) s/mm2 on the 7th day after implantation; C: C1, a low signal of VX-2 tumor on T1WI and C2, a slightly high signal of it on T2WI and a lamellar high signal in the tumor center on T2WI on the 14th day after implantation; D: A high signal and distinct margin of VX-2 tumor on DWI when b value was 100 s/mm2 (D1) and low signal of VX-2 tumor and a lamellar high signal in its center on the map of ADC on the 14th d after implantation (D2); E: A high and uneven signal of VX-2 tumor on DWI when b value was 100 s/mm2 (E1) and low signal of VX-2 tumor while a high signal in the center tumor on the map of ADC on the 21th d after implantation (E2).
- Citation: Yuan YH, Xiao EH, Liu JB, He Z, Jin K, Ma C, Xiang J, Xiao JH, Chen WJ. Characteristics of liver on magnetic resonance diffusion-weighted imaging: Dynamic and image pathological investigation in rabbit liver VX-2 tumor model. World J Gastroenterol 2008; 14(25): 3997-4004
- URL: https://www.wjgnet.com/1007-9327/full/v14/i25/3997.htm
- DOI: https://dx.doi.org/10.3748/wjg.14.3997


