Copyright
©2008 The WJG Press and Baishideng.
World J Gastroenterol. Jun 28, 2008; 14(24): 3819-3828
Published online Jun 28, 2008. doi: 10.3748/wjg.14.3819
Published online Jun 28, 2008. doi: 10.3748/wjg.14.3819
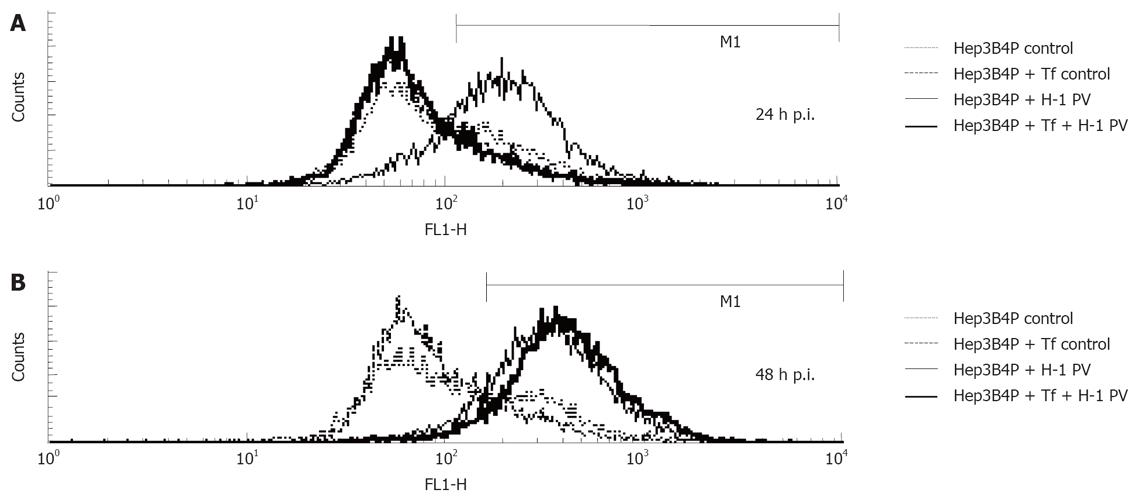
Figure 3 Analysis of mitochondrial membrane potential.
Kinetics of reduction of the mitochondrial membrane potential. Hepatoma cells were left untreated (control) or infected (H-1 PV) for the indicated periods of time and analyzed by flow cytometry using the fluorochrome JC-1. The percentage of cells with decreased mitochondrial membrane potential is shown. After one (A) and two (B) days incubation, the percentage of cells with decreased mitochondrial membrane potential were determined by flow cytometry.
- Citation: Sieben M, Herzer K, Zeidler M, Heinrichs V, Leuchs B, Schuler M, Cornelis JJ, Galle PR, Rommelaere J, Moehler M. Killing of p53-deficient hepatoma cells by parvovirus H-1 and chemotherapeutics requires promyelocytic leukemia protein. World J Gastroenterol 2008; 14(24): 3819-3828
- URL: https://www.wjgnet.com/1007-9327/full/v14/i24/3819.htm
- DOI: https://dx.doi.org/10.3748/wjg.14.3819


