Copyright
©2008 The WJG Press and Baishideng.
World J Gastroenterol. Jun 21, 2008; 14(23): 3710-3718
Published online Jun 21, 2008. doi: 10.3748/wjg.14.3710
Published online Jun 21, 2008. doi: 10.3748/wjg.14.3710
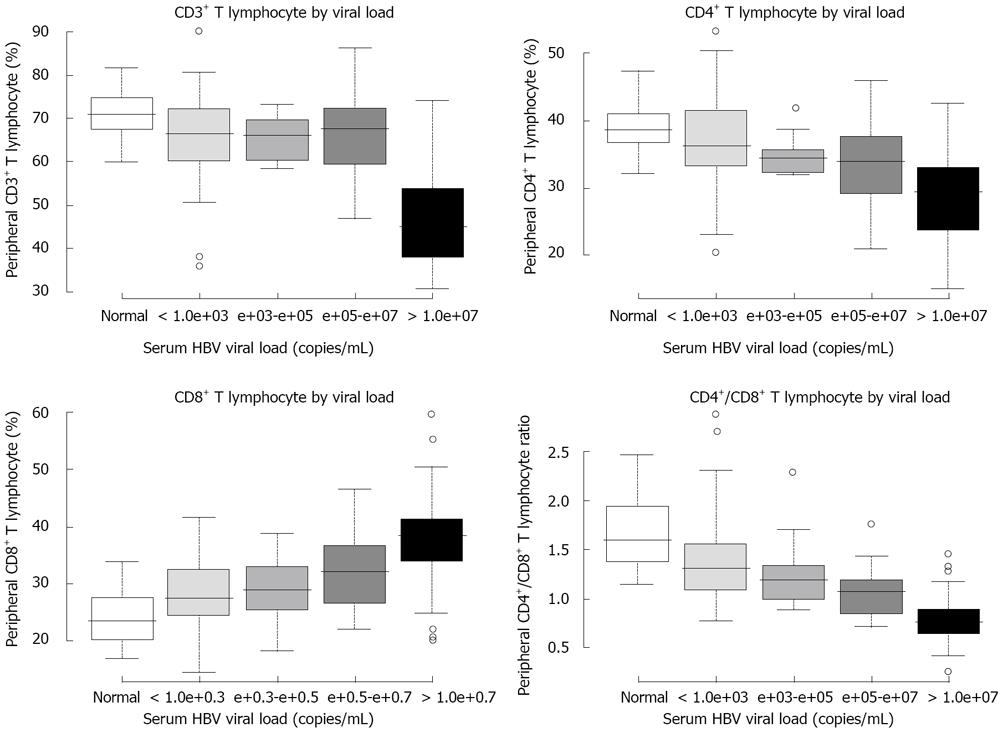
Figure 2 Peripheral T-lymphocyte subpopulations by serum HBV viral load.
Composition of T-cell subpopulations from peripheral blood of patients with various serum HBV viral loads. Results are expressed as percentage of cells for each phenotype. Top of the box represents the 75th percentile, the bottom of the box represents the 25th percentile, and the solid line in the middle of the box represents the median. Whiskers above and below the box indicate the 90th and 10th percentiles, while circles represent outliers. Linear dose-response relationship between the level of T-lymphocyte subpopulations and copies of HBV DNA was highly significant (linear trend test, P value < 0.001). On the figure, the marks “< 1.0e+03”, “e+03-e+05”, “e+05-e+07” and “> 1.0e+07” denote “< 103”, “103-105”, “105-107” and “> 107”, respectively.
- Citation: You J, Sriplung H, Geater A, Chongsuvivatwong V, Zhuang L, Chen HY, Huang JH, Tang BZ. Hepatitis B virus DNA is more powerful than HBeAg in predicting peripheral T-lymphocyte subpopulations in chronic HBV-infected individuals with normal liver function tests. World J Gastroenterol 2008; 14(23): 3710-3718
- URL: https://www.wjgnet.com/1007-9327/full/v14/i23/3710.htm
- DOI: https://dx.doi.org/10.3748/wjg.14.3710


