Copyright
©2008 The WJG Press and Baishideng.
World J Gastroenterol. Jun 14, 2008; 14(22): 3569-3573
Published online Jun 14, 2008. doi: 10.3748/wjg.14.3569
Published online Jun 14, 2008. doi: 10.3748/wjg.14.3569
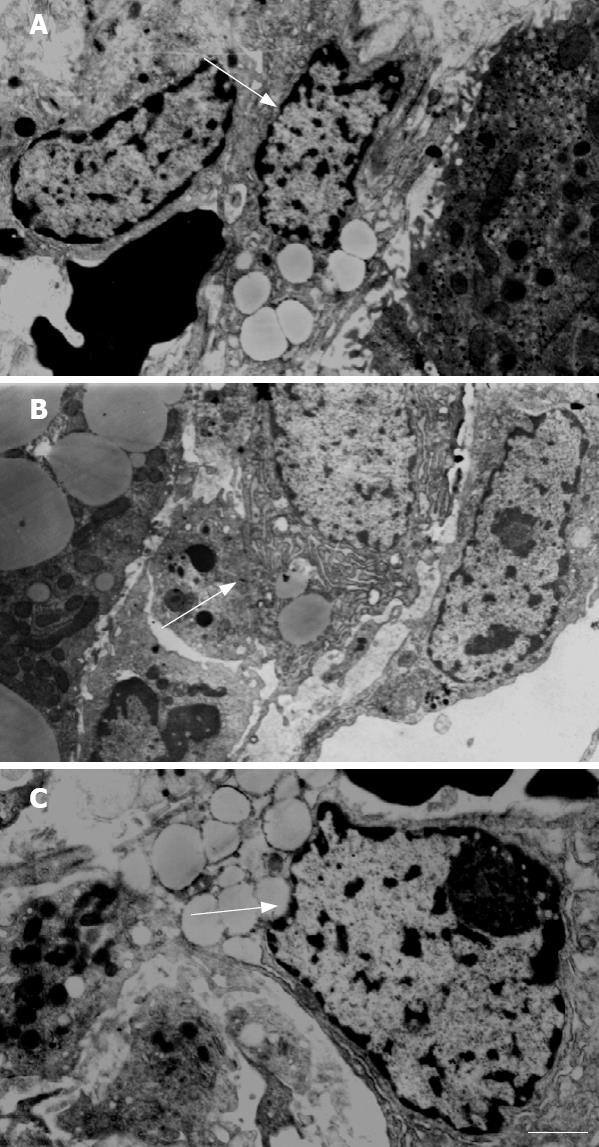
Figure 2 Electron microscopy showing normal HSC in the model group (A), typical myofibroblasts in the control group (B) (× 5000, bar = 1 &mgr;m), and “transitional” HSC (× 6000, bar = 1 &mgr;m) in Qianggan-Rongxian Decoction treatment group (C).
-
Citation: Li CH, Pan LH, Yang ZW, Li CY, Xu WX. Preventive effect of
Qianggan-Rongxian Decoction on rat liver fibrosis. World J Gastroenterol 2008; 14(22): 3569-3573 - URL: https://www.wjgnet.com/1007-9327/full/v14/i22/3569.htm
- DOI: https://dx.doi.org/10.3748/wjg.14.3569


