Copyright
©2008 The WJG Press and Baishideng.
World J Gastroenterol. Jun 14, 2008; 14(22): 3476-3483
Published online Jun 14, 2008. doi: 10.3748/wjg.14.3476
Published online Jun 14, 2008. doi: 10.3748/wjg.14.3476
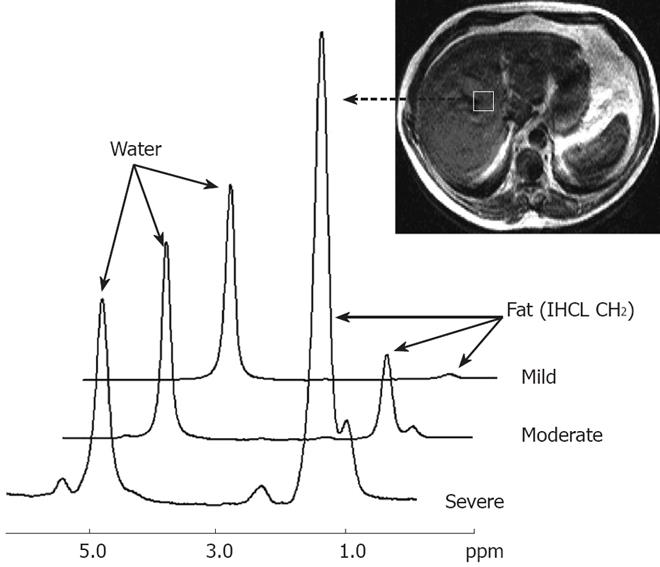
Figure 5 Proton magnetic resonance spectra from three volunteers showing progressive degrees of hepatic fatty infiltration.
Resonances from water and lipid (IHCL CH2) can be clearly seen. For each individual hepatic fatty infiltration was quantified using the equation: -Percentage fat = IHCL CH2 peak area/Water peak area × 100. Shown are spectra from a liver with very mild fatty infiltration (1.0%), a liver with moderate fatty infiltration (10.2%), and a liver with severe fatty infiltration (74.9%). Adapted from Thomas et al. Gut 2005; 54: 122-127, with permission from the BMJ Publishing Group.
- Citation: Mehta SR, Thomas EL, Bell JD, Johnston DG, Taylor-Robinson SD. Non-invasive means of measuring hepatic fat content. World J Gastroenterol 2008; 14(22): 3476-3483
- URL: https://www.wjgnet.com/1007-9327/full/v14/i22/3476.htm
- DOI: https://dx.doi.org/10.3748/wjg.14.3476


