Copyright
©2008 The WJG Press and Baishideng.
World J Gastroenterol. Jan 14, 2008; 14(2): 236-242
Published online Jan 14, 2008. doi: 10.3748/wjg.14.236
Published online Jan 14, 2008. doi: 10.3748/wjg.14.236
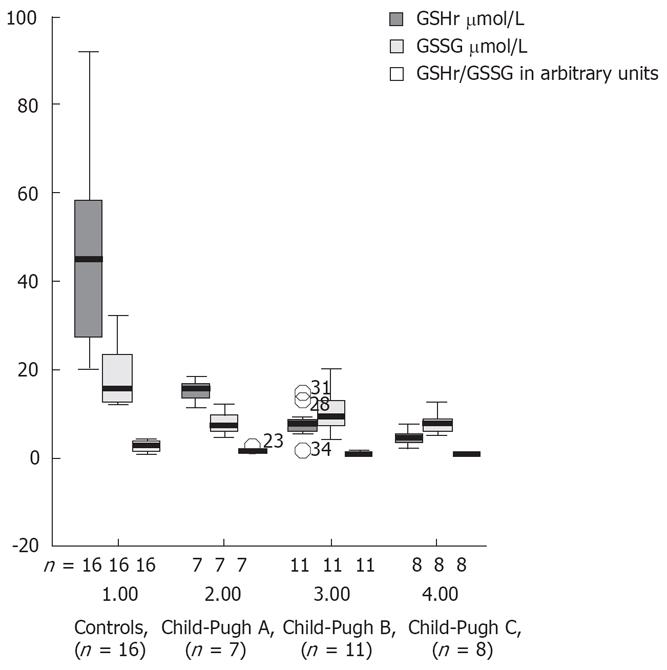
Figure 6 Boxes show the interquartile ranges.
Vertical lines show 80% of the values (10th-90th percentiles). The bold horizontal line represents the median. bP < 0.01 between controls and patients with Child-Pugh A cirrhosis or between patients with Child-Pugh B cirrhosis or between Child-Pugh C cirrhosis.
- Citation: Siqueira C, Moura MC, Pedro AJ, Rocha P. Elevated nitric oxide and 3’,5’ cyclic guanosine monophosphate levels in patients with alcoholic cirrhosis. World J Gastroenterol 2008; 14(2): 236-242
- URL: https://www.wjgnet.com/1007-9327/full/v14/i2/236.htm
- DOI: https://dx.doi.org/10.3748/wjg.14.236


