Copyright
©2008 The WJG Press and Baishideng.
World J Gastroenterol. Jan 14, 2008; 14(2): 224-230
Published online Jan 14, 2008. doi: 10.3748/wjg.14.224
Published online Jan 14, 2008. doi: 10.3748/wjg.14.224
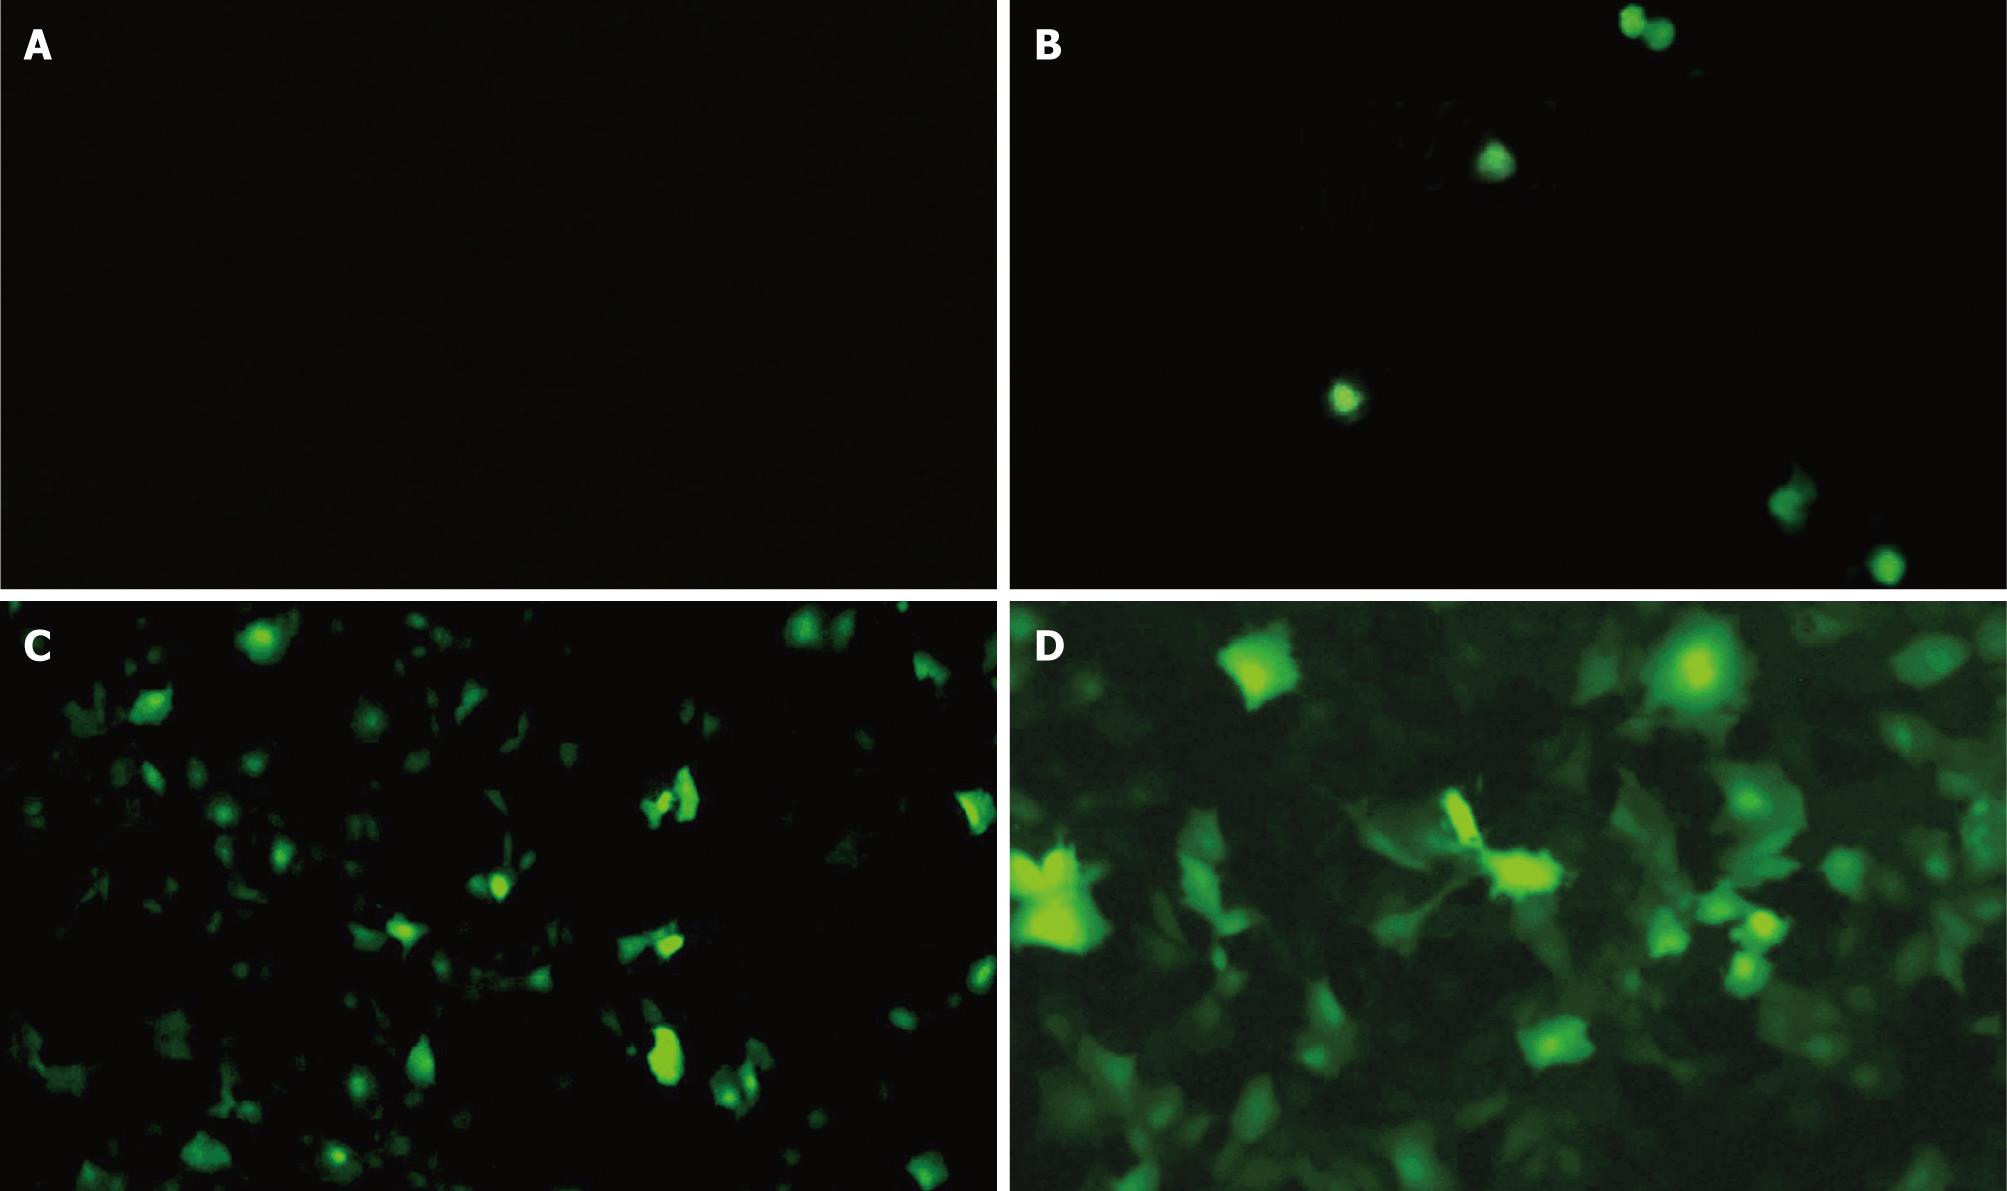
Figure 6 Fluorescent microscopy showed EGFP expression 48 h after pEGFP-KDR-TK transfection.
A: Shows no obvious EGFP expression in cells without microbubbles and ultrasound (× 200); B: 1.7% cells exposed to ultrasound only shows EGFP expression (× 200); C, D: Significant increase in EGFP expression in HUVECs exposed to both the ultrasound and SonoVue (C: × 200, D: × 400). About 20.3% HUVECs had EGFP expression.
- Citation: Wang Y, Xu HX, Lu MD, Tang Q. Expression of thymidine kinase mediated by a novel non-viral delivery system under the control of vascular endothelial growth factor receptor 2 promoter selectively kills human umbilical vein endothelial cells. World J Gastroenterol 2008; 14(2): 224-230
- URL: https://www.wjgnet.com/1007-9327/full/v14/i2/224.htm
- DOI: https://dx.doi.org/10.3748/wjg.14.224


