Copyright
©2008 The WJG Press and Baishideng.
World J Gastroenterol. May 21, 2008; 14(19): 3006-3014
Published online May 21, 2008. doi: 10.3748/wjg.14.3006
Published online May 21, 2008. doi: 10.3748/wjg.14.3006
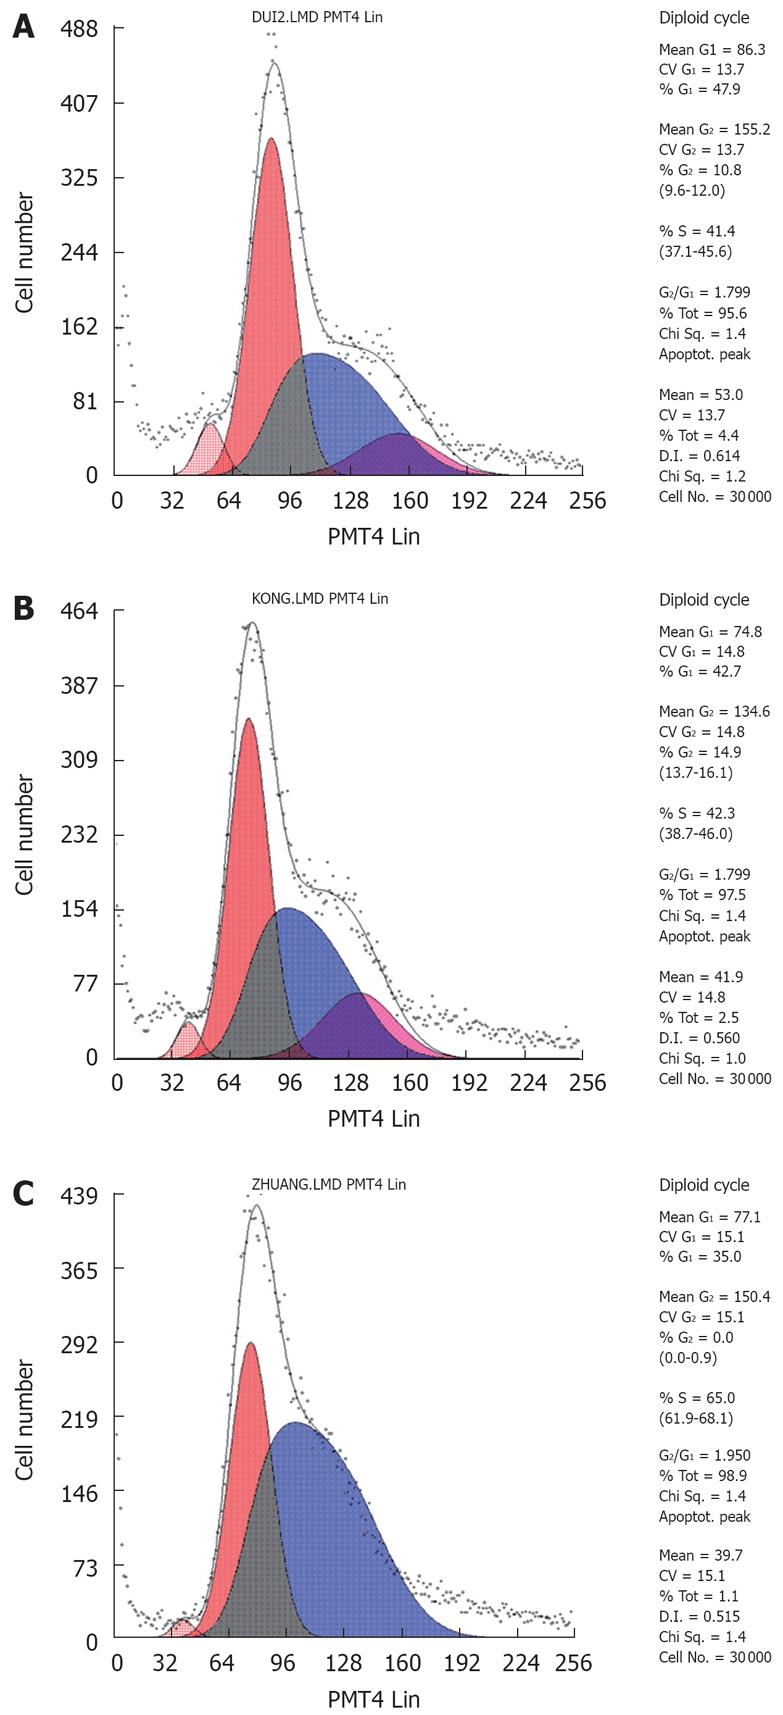
Figure 8 The cell cycle analysis by FCM.
A: SGC790 cells, the cell proportions of G0/G1 and S stages were 43.2% ± 1.2% and 47.7% ± 1.1% in the SGC7901cell without transfection, respectively; B: pSilencer3.1-H1/SGC7901 cells, the cell proportions of G0/G1 and S stages were 40.3% ± 2.0% and 49.3% ± 0.9% in the SGC7901 cell with the plasmid DNA of pSilencer3.1-H1 respectively; C: pSilencer3.1-shRNA/RUNX3SGC7901 cells, the cell proportions of G0/G1 and S stages were 37.2% ± 1.9% and 60.5% ± 0.8% in the SGC790 cells transfected with the recombinated plasmid-pSilencer3.1-H1-shRNA/RUNX3 respectively. Compared with that of G0/G1 and S stages of two controls, the cell proportions of G0/G1 and S stages in the pSilencer3.1-H1-shRNA/RUNX3/SGC7901 cells decreased and increased obviously, respectively (P < 0.05).
-
Citation: Feng XZ, He XS, Zhuang YZ, Luo Q, Jiang JH, Yang S, Tang XF, Liu JL, Chen T. Investigation of transcriptional gene silencing and mechanism induced by shRNAs targeted to
RUNX3 in vitro . World J Gastroenterol 2008; 14(19): 3006-3014 - URL: https://www.wjgnet.com/1007-9327/full/v14/i19/3006.htm
- DOI: https://dx.doi.org/10.3748/wjg.14.3006


