Copyright
©2008 The WJG Press and Baishideng.
World J Gastroenterol. May 14, 2008; 14(18): 2894-2899
Published online May 14, 2008. doi: 10.3748/wjg.14.2894
Published online May 14, 2008. doi: 10.3748/wjg.14.2894
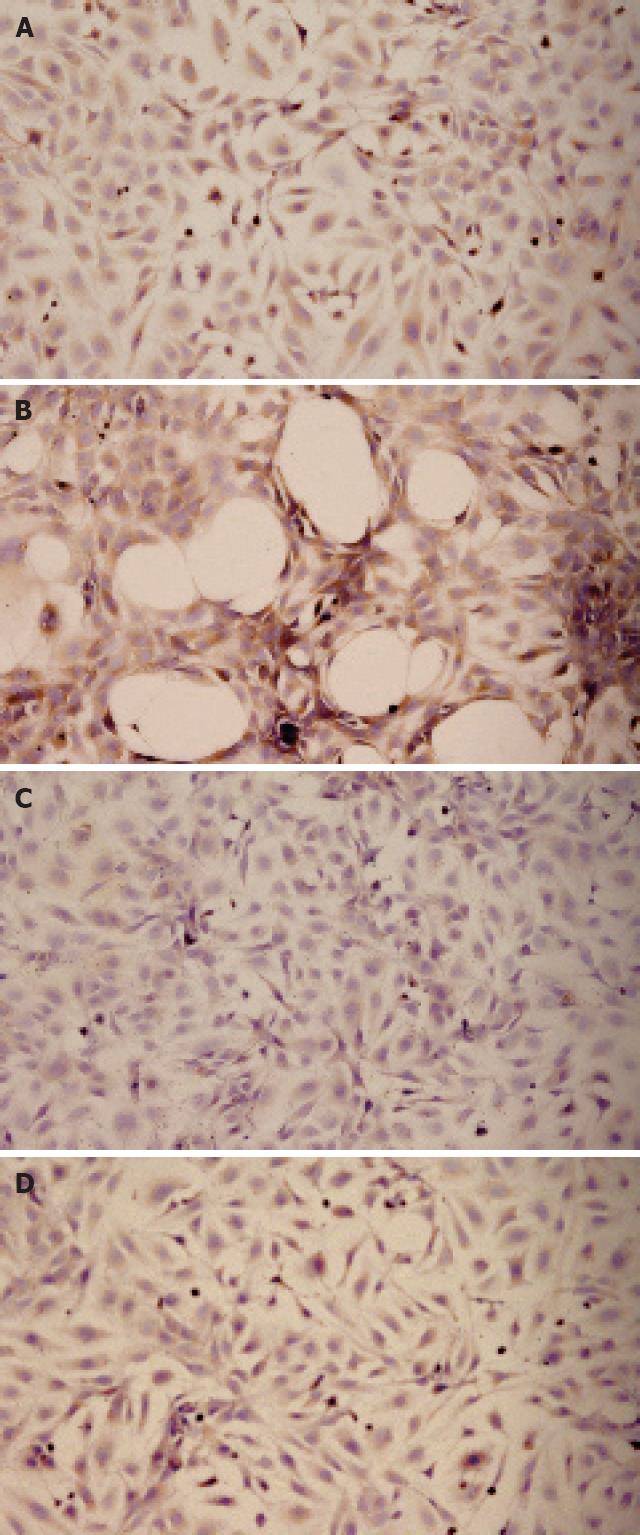
Figure 3 Expression of α-SMA in different treatment groups.
Qualitative expression of α-SMA in control LX-2 cells (A), treated with TGFβ1 (B), Cpd861 (C) and Cpd861 together with TGFβ1 (D) for 24 h using immunohistochemical staining. α-SMA presented brown color in cytoplasm (× 200).
- Citation: Li L, Zhao XY, Wang BE. Down-regulation of transforming growth factor β1/activin receptor-like kinase 1 pathway gene expression by herbal compound 861 is related to deactivation of LX-2 cells. World J Gastroenterol 2008; 14(18): 2894-2899
- URL: https://www.wjgnet.com/1007-9327/full/v14/i18/2894.htm
- DOI: https://dx.doi.org/10.3748/wjg.14.2894


