Copyright
©2008 The WJG Press and Baishideng.
World J Gastroenterol. May 7, 2008; 14(17): 2748-2756
Published online May 7, 2008. doi: 10.3748/wjg.14.2748
Published online May 7, 2008. doi: 10.3748/wjg.14.2748
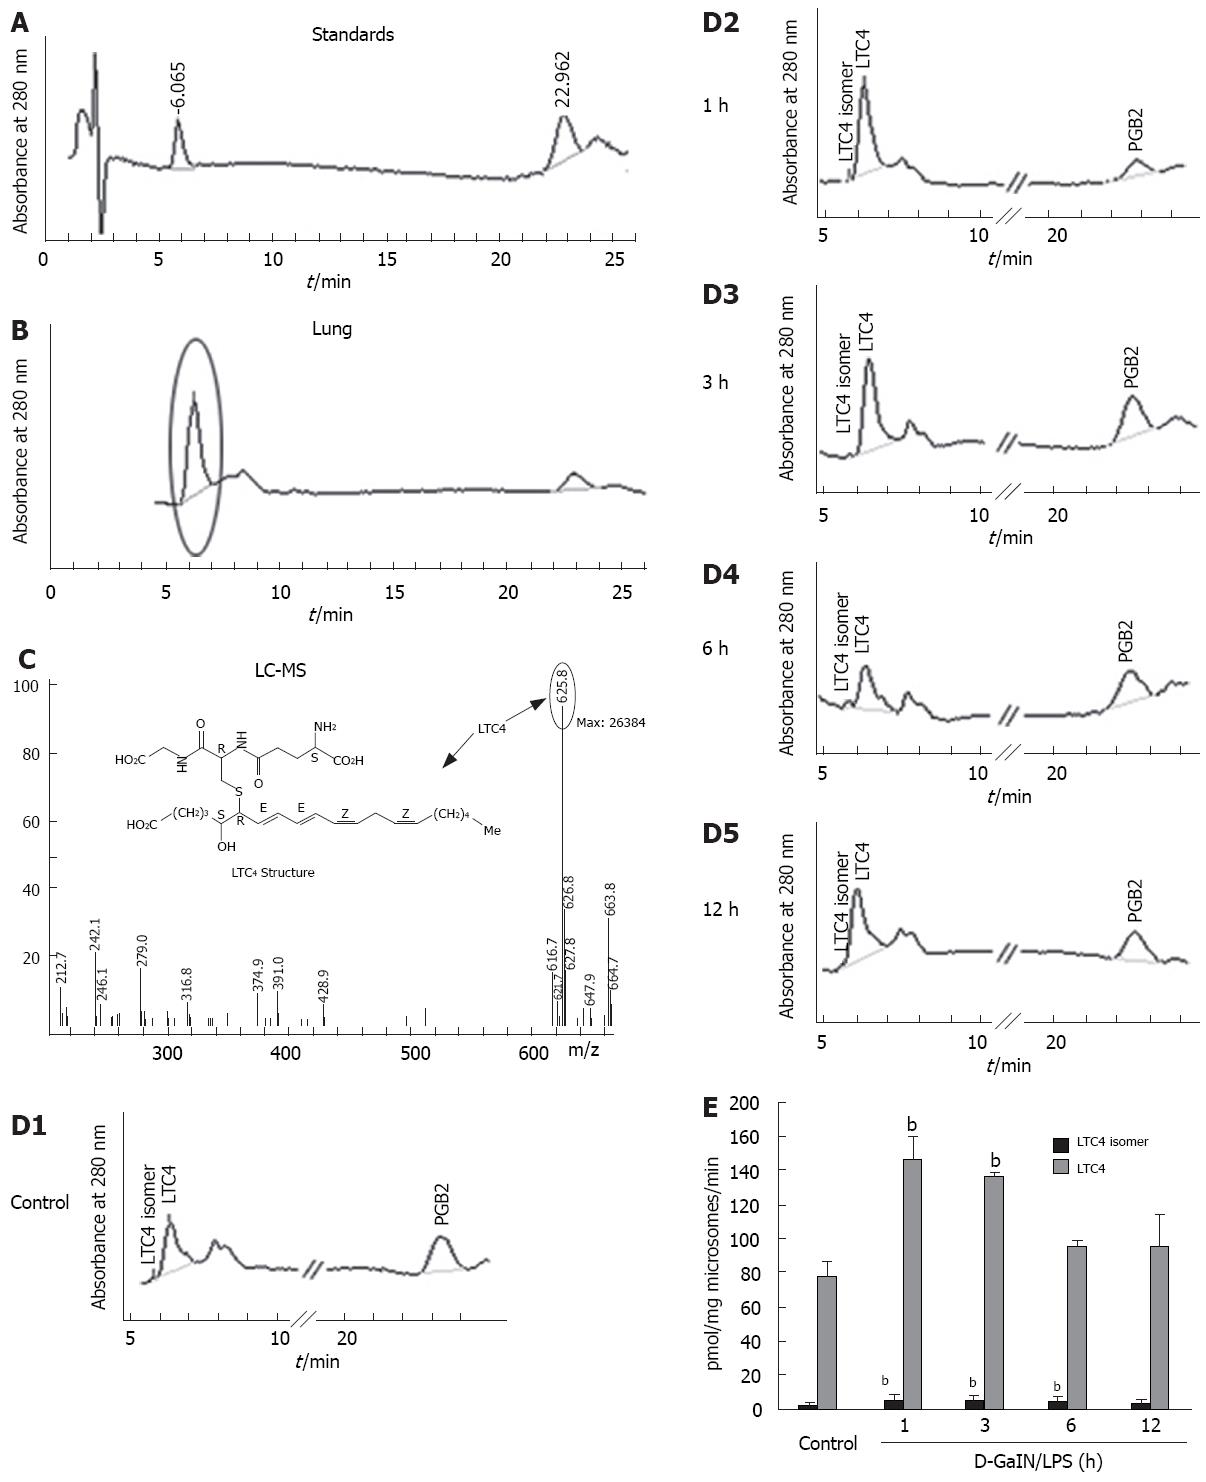
Figure 5 LTC4 synthesis enzyme activity in rat liver microsomal fraction.
A: HPLC traces showing standard LTC4 and internal standard PGB2; B: HPLC traces showing the main products when 100 000 × g pellets from lung incubated with LTA4 (60 &mgr;mol/L) and glutathione (10 mmol/L); C: MS assay of the product showing its peak at the retention time of 6.06 min in HPLC; D: HPLC traces showing generated LTC4 and isomer of LTC4 by a microsomal fraction from D-GalN/LPS treated rat livers with indicated times; E: The amount of generated LTC4 and isomer of LTC4 was calculated by an area peak compared with the internal standard PGB2 and then plotted. Each value represents the mean obtained from duplicate experiments with liver tissue from six rats in each group. aP < 0.05, bP < 0.01 vs control group.
- Citation: Ma KF, Yang HY, Chen Z, Qi LY, Zhu DY, Lou YJ. Enhanced expressions and activations of leukotriene C4 synthesis enzymes in D-galactosamine/lipopolysaccharide-induced rat fulminant hepatic failure model. World J Gastroenterol 2008; 14(17): 2748-2756
- URL: https://www.wjgnet.com/1007-9327/full/v14/i17/2748.htm
- DOI: https://dx.doi.org/10.3748/wjg.14.2748


