Copyright
©2008 The WJG Press and Baishideng.
World J Gastroenterol. May 7, 2008; 14(17): 2748-2756
Published online May 7, 2008. doi: 10.3748/wjg.14.2748
Published online May 7, 2008. doi: 10.3748/wjg.14.2748
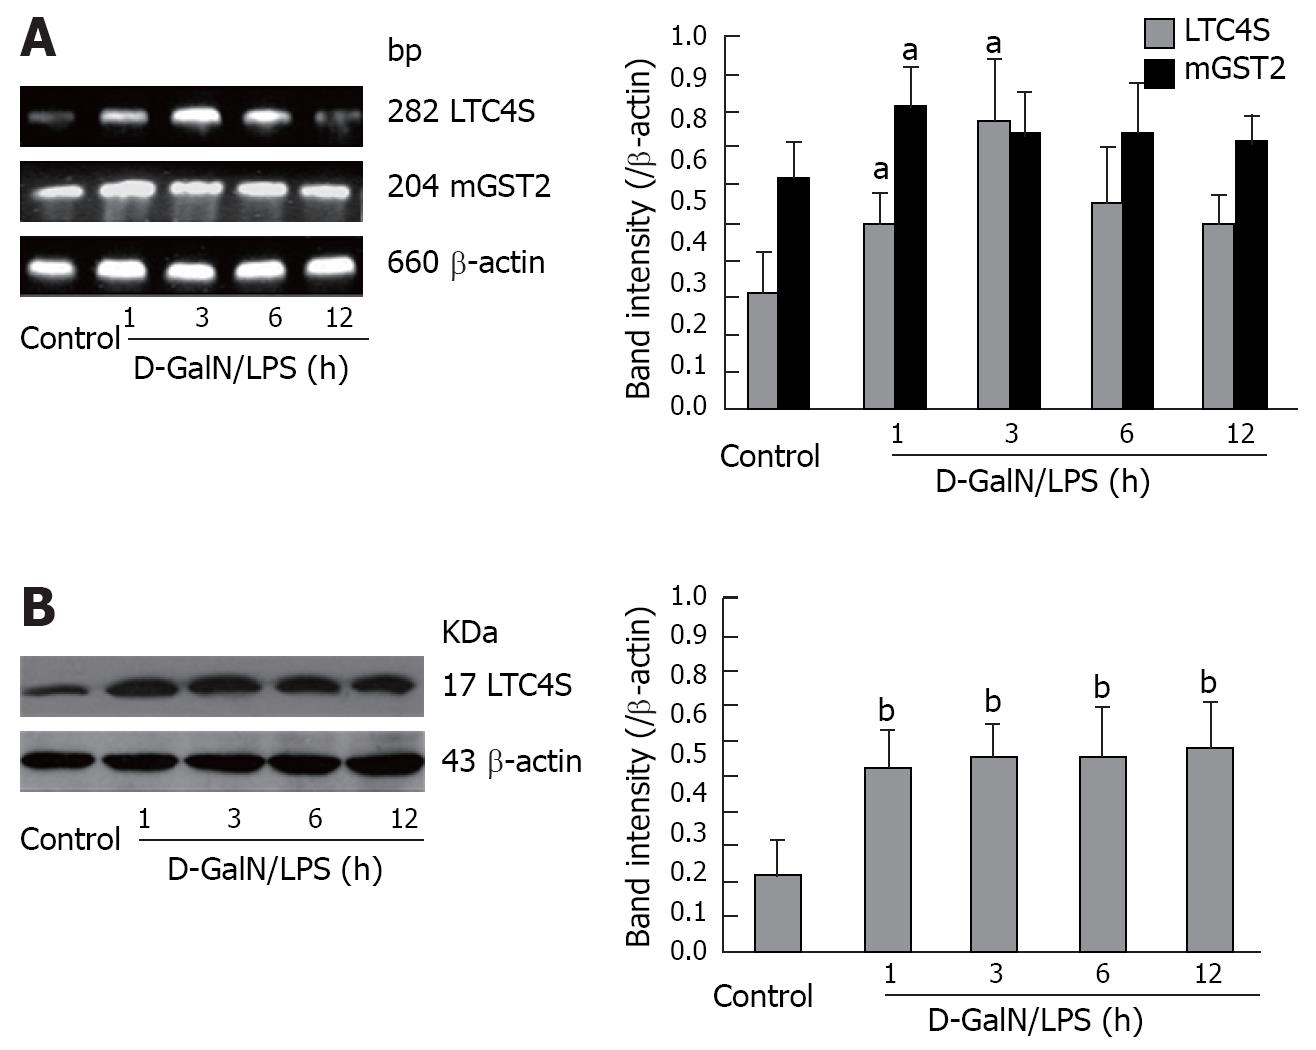
Figure 3 mRNA and protein expressions of LTC4S and mGST2 in D-GalN/LPS-treated liver tissues.
A: mRNA expression of LTC4S and mGST2 detected by RT-PCR. cDNA synthesized from total RNA (3 &mgr;g) was used for PCR amplification with 35 cycles for LTC4S and mGST2. PCR products were electrophoresed on a 1.5% agarose gel. The intensity of each band was quantified by computer-assisted densitometry, and the data were compared to those of the corresponding band of β-actin (Right panel); B: Protein expression of LTC4S detected by Western blotting. An aliquot of total protein (80 &mgr;g) was subjected to immunoblot analysis as described in Methods. Left panel: Immunoreactive bands corresponding to LTC4S and β-actin in D-GalN/LPS-injured liver; right panel: Densities of the products quantified by computer-assisted densitometry, and the data were normalized to β-actin expression. Data are represented as mean ± SD, aP < 0.05, bP < 0.01 vs control group.
- Citation: Ma KF, Yang HY, Chen Z, Qi LY, Zhu DY, Lou YJ. Enhanced expressions and activations of leukotriene C4 synthesis enzymes in D-galactosamine/lipopolysaccharide-induced rat fulminant hepatic failure model. World J Gastroenterol 2008; 14(17): 2748-2756
- URL: https://www.wjgnet.com/1007-9327/full/v14/i17/2748.htm
- DOI: https://dx.doi.org/10.3748/wjg.14.2748


