Copyright
©2008 The WJG Press and Baishideng.
World J Gastroenterol. May 7, 2008; 14(17): 2748-2756
Published online May 7, 2008. doi: 10.3748/wjg.14.2748
Published online May 7, 2008. doi: 10.3748/wjg.14.2748
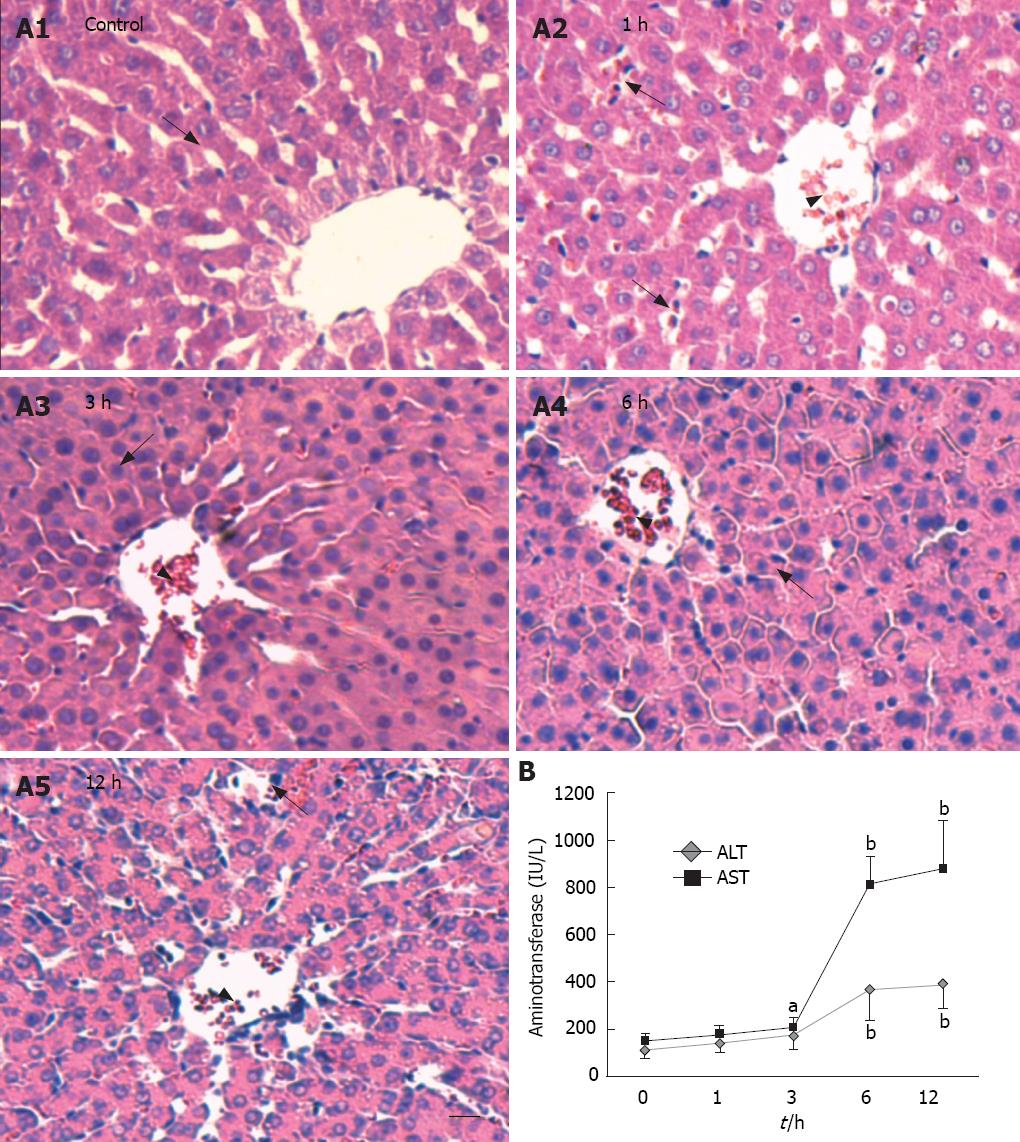
Figure 1 Histology and enzy-mology evaluation of rat livers treated with D-galactosamine/ lipopolysaccharide (D-GalN/LPS).
A: Histological examination of the liver at indicated times after GalN/LPS treatment (hematoxylin-eosin staining, bar = 100 &mgr;m). Arrow heads indicate congested central veins. The arrow in the control group A1 indicates cord-like arrangement of hepatocytes with clear nucleoli. The arrows in the 1 h group A2 indicate infiltrated inflammatory cells. The arrow in the 3 h group A3 indicates swollen hepatocytes. The arrow in the 6 h group A4 indicates disarranged hepatocytes. The arrow in the 12 h group A5 indicates massive necrosis and broken cytolemma; B: Time course of serum ALT and AST in rats received intraperitoneal injection of D-GalN/LPS. Data are represented as mean ± SD, n = 6, aP < 0.05 and bP < 0.01 vs control group.
- Citation: Ma KF, Yang HY, Chen Z, Qi LY, Zhu DY, Lou YJ. Enhanced expressions and activations of leukotriene C4 synthesis enzymes in D-galactosamine/lipopolysaccharide-induced rat fulminant hepatic failure model. World J Gastroenterol 2008; 14(17): 2748-2756
- URL: https://www.wjgnet.com/1007-9327/full/v14/i17/2748.htm
- DOI: https://dx.doi.org/10.3748/wjg.14.2748


