Copyright
©2008 The WJG Press and Baishideng.
World J Gastroenterol. Apr 28, 2008; 14(16): 2501-2510
Published online Apr 28, 2008. doi: 10.3748/wjg.14.2501
Published online Apr 28, 2008. doi: 10.3748/wjg.14.2501
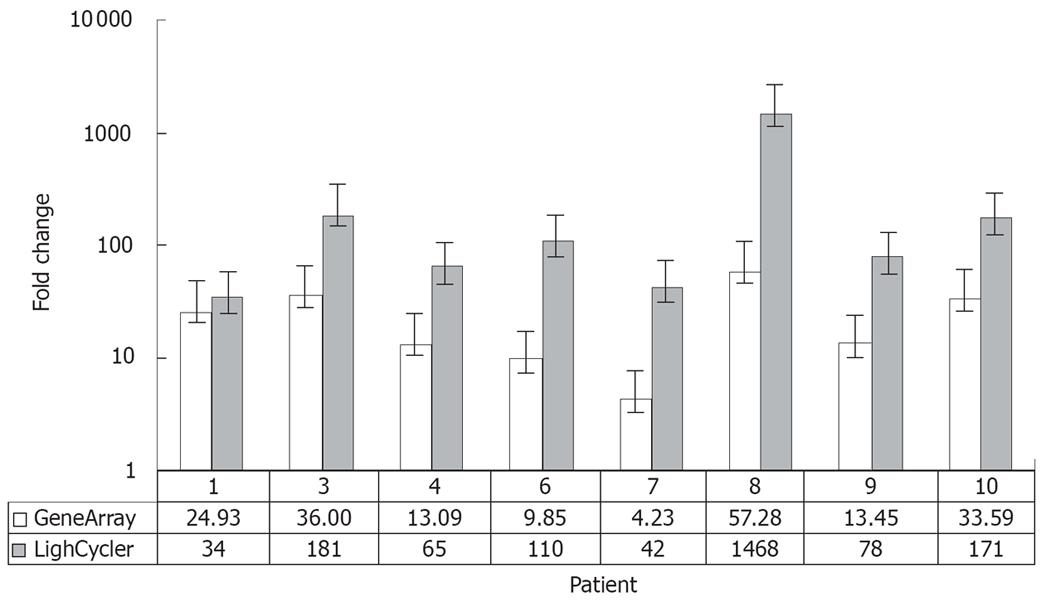
Figure 4 Comparison between expression values of osteopontin in 8 intrahepatic CCCs estimated by RT-PCR (LightCycler®System; grey) and gene expression data (HU 133A, Affymetrix; white).
The detected changes in osteopontin expression levels measured by RT-PCR reflected very well the changes in gene expression between tumor and non-malignant liver tissue obtained by microarray analysis. The results of RT-PCR revealed larger changes than the microarray data in all cases.
- Citation: Hass HG, Nehls O, Jobst J, Frilling A, Vogel U, Kaiser S. Identification of osteopontin as the most consistently over-expressed gene in intrahepatic cholangiocarcinoma: Detection by oligonucleotide microarray and real-time PCR analysis. World J Gastroenterol 2008; 14(16): 2501-2510
- URL: https://www.wjgnet.com/1007-9327/full/v14/i16/2501.htm
- DOI: https://dx.doi.org/10.3748/wjg.14.2501


