Copyright
©2008 The WJG Press and Baishideng.
World J Gastroenterol. Apr 28, 2008; 14(16): 2474-2486
Published online Apr 28, 2008. doi: 10.3748/wjg.14.2474
Published online Apr 28, 2008. doi: 10.3748/wjg.14.2474
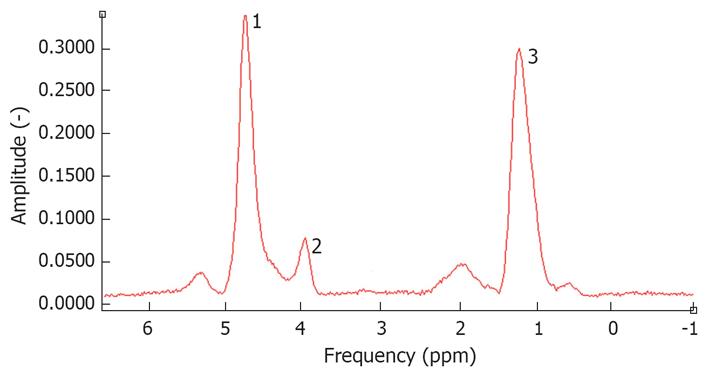
Figure 2 Spectrum of a fatty liver measured by 1H-magnetic resonance spectroscopy.
The water peak is at 4.3 ppm. 1: Residual water partially suppressed; 2: Glycerol/phospholipids; 3: (-CH2-)n of saturated fat.
- Citation: Schreuder TC, Verwer BJ, Nieuwkerk CMV, Mulder CJ. Nonalcoholic fatty liver disease: An overview of current insights in pathogenesis, diagnosis and treatment. World J Gastroenterol 2008; 14(16): 2474-2486
- URL: https://www.wjgnet.com/1007-9327/full/v14/i16/2474.htm
- DOI: https://dx.doi.org/10.3748/wjg.14.2474


