Copyright
©2008 The WJG Press and Baishideng.
World J Gastroenterol. Apr 21, 2008; 14(15): 2329-2337
Published online Apr 21, 2008. doi: 10.3748/wjg.14.2329
Published online Apr 21, 2008. doi: 10.3748/wjg.14.2329
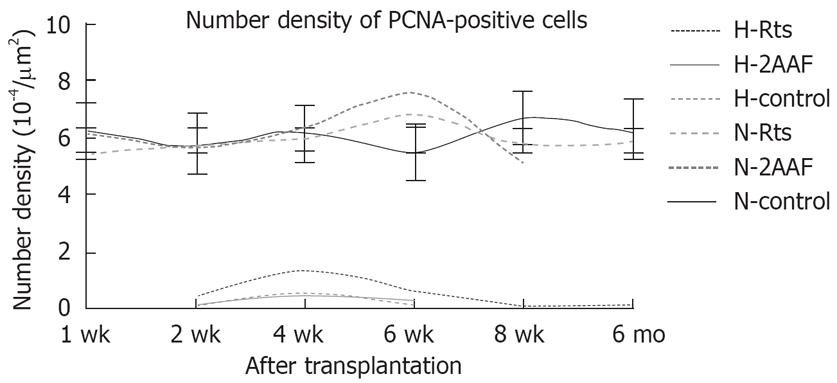
Figure 4 Curve chart of number density of PCNA-positive cells number density of PCNA-positive cells.
Using the primary antibody specifically against human PCNA, there were significant differences in the number density between the Rts and the control group, there were no significant differences between the 2AAF and the control group, while using the primary antibody not specifically against human PCNA, there were no significant differences between either groups.
- Citation: Lin H, Mao Q, Wang YM, Jiang L. Proliferation of L02 human hepatocytes in tolerized genetically immunocompetent rats. World J Gastroenterol 2008; 14(15): 2329-2337
- URL: https://www.wjgnet.com/1007-9327/full/v14/i15/2329.htm
- DOI: https://dx.doi.org/10.3748/wjg.14.2329


