Copyright
©2008 The WJG Press and Baishideng.
World J Gastroenterol. Mar 21, 2008; 14(11): 1759-1767
Published online Mar 21, 2008. doi: 10.3748/wjg.14.1759
Published online Mar 21, 2008. doi: 10.3748/wjg.14.1759
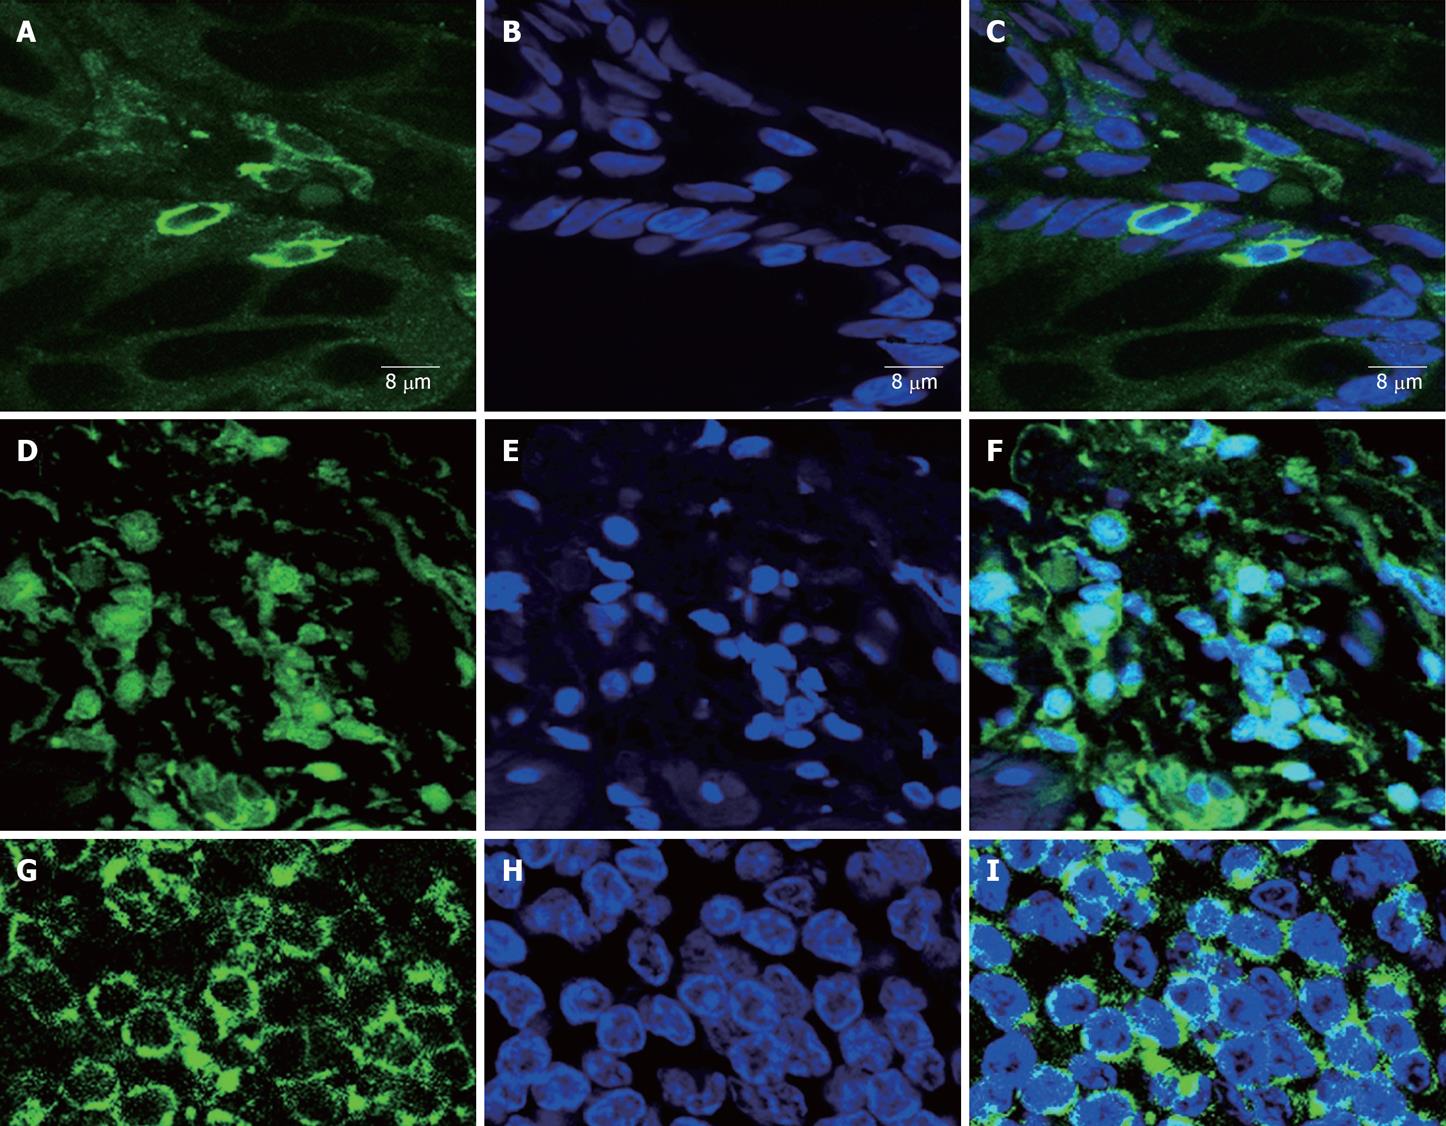
Figure 3 Confocal microscopy demonstrating the subcellular distribution of NFAT2 in LMPCs of colon mucosa.
A-C are derived from normal colon mucosa, while D-F from UC affected mucosa, G-I from CD affected mucosa. A, D, G represent the detection for NFAT2; B, E, H: The nuclei using DAPI; C, F ,I : the merged images for A, B, D, E, G and H, respectively. Of interest, co-localization of NFAT2 with nuclei is noted in the colonic mucosa of UC (F), but not in CD (I), though there is a heavy infiltration of LMPCs in the CD affected colonic mucosa.
- Citation: Shih TC, Hsieh SY, Hsieh YY, Chen TC, Yeh CY, Lin CJ, Lin DY, Chiu CT. Aberrant activation of nuclear factor of activated T cell 2 in lamina propria mononuclear cells in ulcerative colitis. World J Gastroenterol 2008; 14(11): 1759-1767
- URL: https://www.wjgnet.com/1007-9327/full/v14/i11/1759.htm
- DOI: https://dx.doi.org/10.3748/wjg.14.1759


