Copyright
©2008 The WJG Press and Baishideng.
World J Gastroenterol. Mar 14, 2008; 14(10): 1521-1527
Published online Mar 14, 2008. doi: 10.3748/wjg.14.1521
Published online Mar 14, 2008. doi: 10.3748/wjg.14.1521
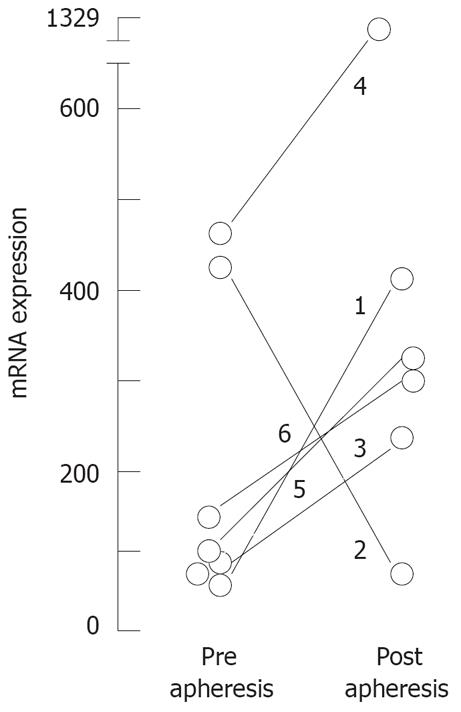
Figure 2 Variation of mRNA expression for FoxP3 in CD4+ T cells in matched samples from 6 patients treated by GMA-apheresis: Quantitative PCR was performed as described in methods; Results are expressed as FoxP3 expression relative to GUS expression per cent.
- Citation: Cuadrado E, Alonso M, Juan MD, Echaniz P, Arenas JI. Regulatory T cells in patients with inflammatory bowel diseases treated with adacolumn granulocytapheresis. World J Gastroenterol 2008; 14(10): 1521-1527
- URL: https://www.wjgnet.com/1007-9327/full/v14/i10/1521.htm
- DOI: https://dx.doi.org/10.3748/wjg.14.1521


