Copyright
©2007 Baishideng Publishing Group Co.
World J Gastroenterol. Mar 7, 2007; 13(9): 1393-1398
Published online Mar 7, 2007. doi: 10.3748/wjg.v13.i9.1393
Published online Mar 7, 2007. doi: 10.3748/wjg.v13.i9.1393
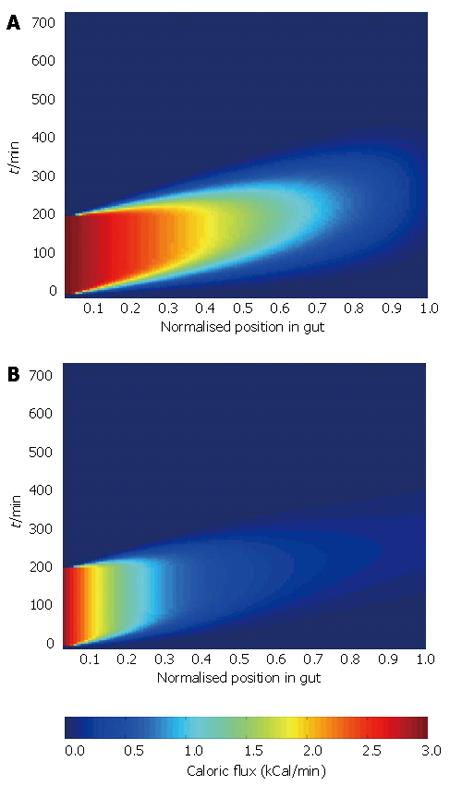
Figure 4 Pseudocolour plots showing caloric load against time and position in the gut for given gastric emptying and transit spectrum data with 96% gastric efficiency, based on linear (A) and asymptotic (B) absorption profiles.
- Citation: Jeays AD, Lawford PV, Gillott R, Spencer PA, Bardhan KD, Hose DR. A framework for the modeling of gut blood flow regulation and postprandial hyperaemia. World J Gastroenterol 2007; 13(9): 1393-1398
- URL: https://www.wjgnet.com/1007-9327/full/v13/i9/1393.htm
- DOI: https://dx.doi.org/10.3748/wjg.v13.i9.1393


