Copyright
©2007 Baishideng Publishing Group Co.
World J Gastroenterol. Mar 7, 2007; 13(9): 1335-1346
Published online Mar 7, 2007. doi: 10.3748/wjg.v13.i9.1335
Published online Mar 7, 2007. doi: 10.3748/wjg.v13.i9.1335
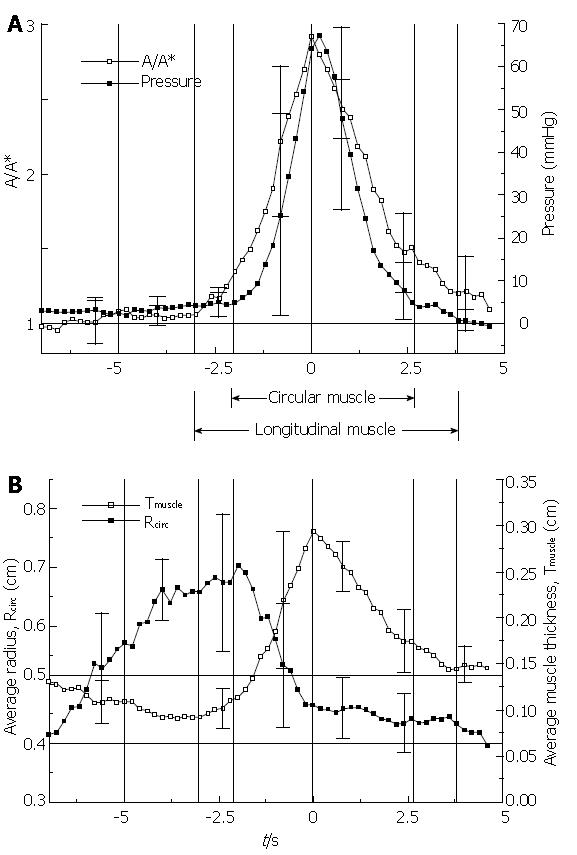
Figure 8 The primary result from Nicosia et al[1].
In (A) the inverse of local longitudinal shortening (A/A* = 1/(L/L*), see equation 2) is plotted together with circular muscle closure pressure (see equation 1) and in (B) the effective thickness of the muscularis propria is plotted together with effective lumen radius. All variables are plotted during the passage of a peristaltic wave with the transport of a 10 mL liquid bolus in the mid esophagus. Averages over four normal subjects were done referenced to the peak in LLS.
-
Citation: Brasseur JG, Nicosia MA, Pal A, Miller LS. Function of longitudinal
vs circular muscle fibers in esophageal peristalsis, deduced with mathematical modeling. World J Gastroenterol 2007; 13(9): 1335-1346 - URL: https://www.wjgnet.com/1007-9327/full/v13/i9/1335.htm
- DOI: https://dx.doi.org/10.3748/wjg.v13.i9.1335


