Copyright
©2007 Baishideng Publishing Group Co.
World J Gastroenterol. Mar 7, 2007; 13(9): 1335-1346
Published online Mar 7, 2007. doi: 10.3748/wjg.v13.i9.1335
Published online Mar 7, 2007. doi: 10.3748/wjg.v13.i9.1335
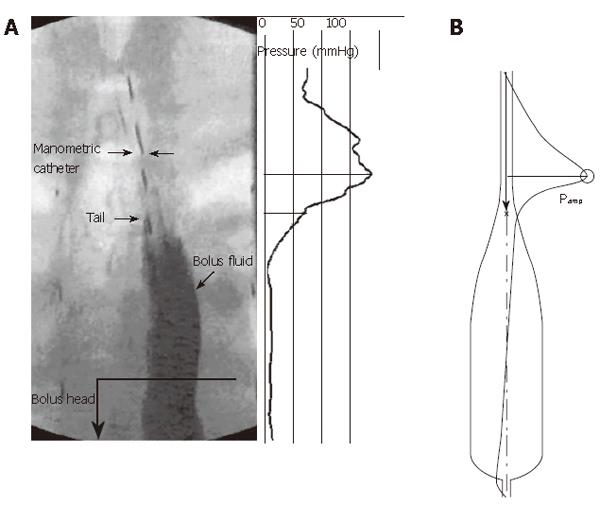
Figure 2 Frozen time image of peristaltic transport of a liquid bolus through the esophagus, with corresponding spatial variation in intraluminal pressure.
A: Fluoroscopic image and pressure distribution (relative to atmospheric) concurrent with interpolated high-resolution manometry data; B: Bolus shape and overlayed pressure distribution from a mathematical model computer simulation.
-
Citation: Brasseur JG, Nicosia MA, Pal A, Miller LS. Function of longitudinal
vs circular muscle fibers in esophageal peristalsis, deduced with mathematical modeling. World J Gastroenterol 2007; 13(9): 1335-1346 - URL: https://www.wjgnet.com/1007-9327/full/v13/i9/1335.htm
- DOI: https://dx.doi.org/10.3748/wjg.v13.i9.1335


