Copyright
©2007 Baishideng Publishing Group Co.
World J Gastroenterol. Feb 28, 2007; 13(8): 1214-1220
Published online Feb 28, 2007. doi: 10.3748/wjg.v13.i8.1214
Published online Feb 28, 2007. doi: 10.3748/wjg.v13.i8.1214
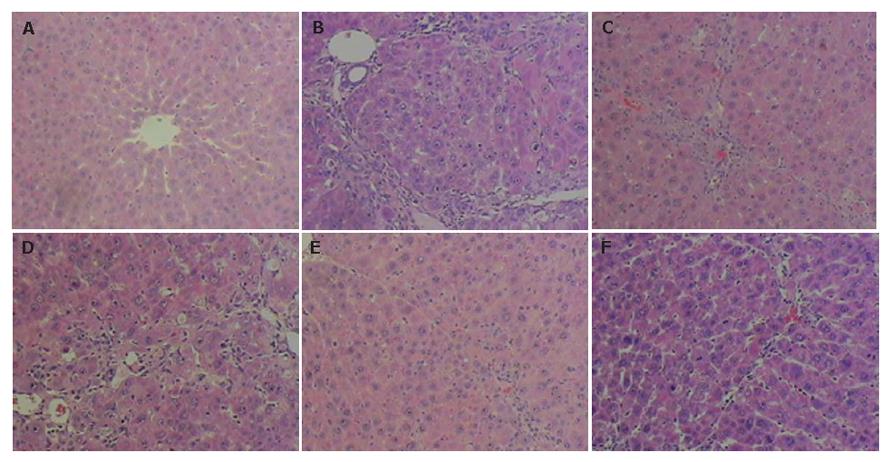
Figure 3 Light microscopic appearance (HE × 100) of fibrotic rat liver induced by TAA treated with tetrandrine for 4 wk.
A: normal group; B: control group; C: TAA group with tetrandrine (5 mg/kg); D: TAA group with tetrandrine (10 mg/kg); E: TAA group with tetrandrine (20 mg/kg); F: TAA group with interferon-г (5 × 10⁴ U).
- Citation: Yin MF, Lian LH, Piao DM, Nan JX. Tetrandrine stimulates the apoptosis of hepatic stellate cells and ameliorates development of fibrosis in a thioacetamide rat model. World J Gastroenterol 2007; 13(8): 1214-1220
- URL: https://www.wjgnet.com/1007-9327/full/v13/i8/1214.htm
- DOI: https://dx.doi.org/10.3748/wjg.v13.i8.1214


