Copyright
©2007 Baishideng Publishing Group Co.
World J Gastroenterol. Feb 28, 2007; 13(8): 1214-1220
Published online Feb 28, 2007. doi: 10.3748/wjg.v13.i8.1214
Published online Feb 28, 2007. doi: 10.3748/wjg.v13.i8.1214
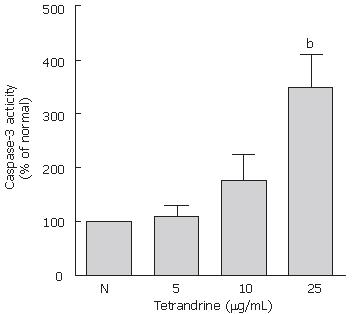
Figure 1 Caspase activity analysis.
The caspase activity of normal cells was set at 100% and relative changes in activity are shown in association with drug doses. Values represent the results of three separate experiments. bP < 0.001, vs normal control values.
- Citation: Yin MF, Lian LH, Piao DM, Nan JX. Tetrandrine stimulates the apoptosis of hepatic stellate cells and ameliorates development of fibrosis in a thioacetamide rat model. World J Gastroenterol 2007; 13(8): 1214-1220
- URL: https://www.wjgnet.com/1007-9327/full/v13/i8/1214.htm
- DOI: https://dx.doi.org/10.3748/wjg.v13.i8.1214


