Copyright
©2007 Baishideng Publishing Group Co.
World J Gastroenterol. Feb 28, 2007; 13(8): 1175-1181
Published online Feb 28, 2007. doi: 10.3748/wjg.v13.i8.1175
Published online Feb 28, 2007. doi: 10.3748/wjg.v13.i8.1175
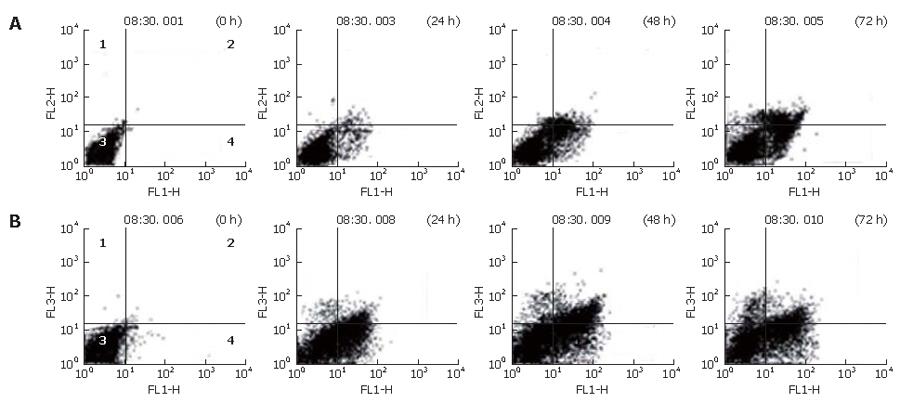
Figure 3 Flow cytometric analysis after exposure of HepG2 (A) and Huh7 (B) cells to NS-398.
Cells were treated with 100 μmol/L NS-398 for 24, 48, and 72 h, stained with annexin V-FITC and propidium iodide and analyzed on a FACScalibur flow cytometer. Quadrants 2-4 represent secondary necrotic cells, viable cells, and apoptotic cells, respectively.
-
Citation: Baek JY, Hur W, Wang JS, Bae SH, Yoon SK. Selective COX-2 inhibitor, NS-398, suppresses cellular proliferation in human hepatocellular carcinoma cell lines
via cell cycle arrest. World J Gastroenterol 2007; 13(8): 1175-1181 - URL: https://www.wjgnet.com/1007-9327/full/v13/i8/1175.htm
- DOI: https://dx.doi.org/10.3748/wjg.v13.i8.1175


