Copyright
©2007 Baishideng Publishing Group Co.
World J Gastroenterol. Feb 21, 2007; 13(7): 1060-1066
Published online Feb 21, 2007. doi: 10.3748/wjg.v13.i7.1060
Published online Feb 21, 2007. doi: 10.3748/wjg.v13.i7.1060
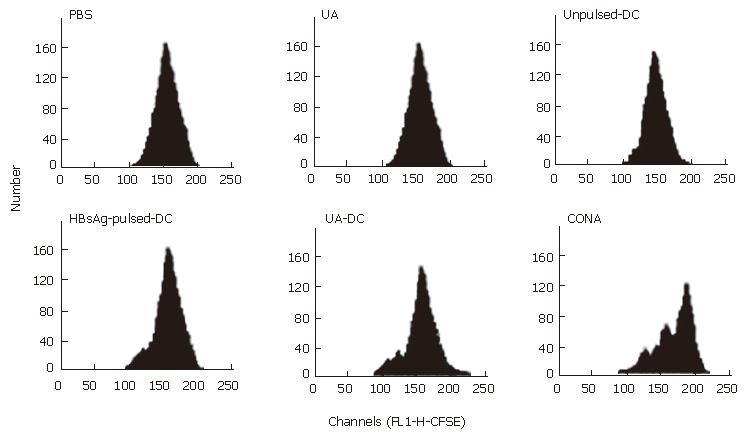
Figure 3 Celluar proliferative response in spleen T cells after stimulation with HBsAg or PBS for 72 h in vitro.
Celluar proliferative response was estimated by flow cytometry. Spleen T cells of PBS group mice were cultured with HBsAg or PBS and ConA, used as ConA group. Histogram was produced by the modfit 3.0 software packages. These results showed were from individual mice that were representative of per experiment group.
- Citation: Ma XJ, Tian DY, Xu D, Yang DF, Zhu HF, Liang ZH, Zhang ZG. Uric acid enhances T cell immune responses to hepatitis B surface antigen-pulsed-dendritic cells in mice. World J Gastroenterol 2007; 13(7): 1060-1066
- URL: https://www.wjgnet.com/1007-9327/full/v13/i7/1060.htm
- DOI: https://dx.doi.org/10.3748/wjg.v13.i7.1060


