Copyright
©2007 Baishideng Publishing Group Co.
World J Gastroenterol. Feb 14, 2007; 13(6): 845-850
Published online Feb 14, 2007. doi: 10.3748/wjg.v13.i6.845
Published online Feb 14, 2007. doi: 10.3748/wjg.v13.i6.845
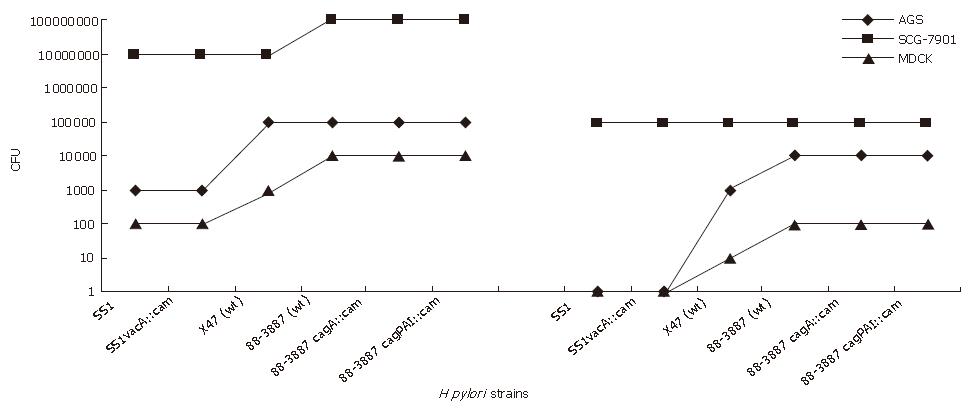
Figure 1 Levels of adherence and invasion of H pylori in different cell lines.
Bacteria were added to AGS cell monolayer at an MOI of 100 for 5 h at 37°C in a humidified atmosphere with 5% CO2. Data were obtained by adherence and invasiveness assays in three independent experiments and are expressed as CFU per well of AGS cells. The left side 3 refrangible lines indicate the ability of the adherence in 3 different cell lines. The right sides indicate the invasiveness ability in the 3 cell lines. Values represent the mean CFU of viable bacteria recovered per well of a 24-well tissue culture tray.
-
Citation: Zhang MJ, Meng FL, Ji XY, He LH, Zhang JZ. Adherence and invasion of mouse-adapted
H pylori in different epithelial cell lines. World J Gastroenterol 2007; 13(6): 845-850 - URL: https://www.wjgnet.com/1007-9327/full/v13/i6/845.htm
- DOI: https://dx.doi.org/10.3748/wjg.v13.i6.845


