Copyright
©2007 Baishideng Publishing Group Co.
World J Gastroenterol. Feb 14, 2007; 13(6): 821-825
Published online Feb 14, 2007. doi: 10.3748/wjg.v13.i6.821
Published online Feb 14, 2007. doi: 10.3748/wjg.v13.i6.821
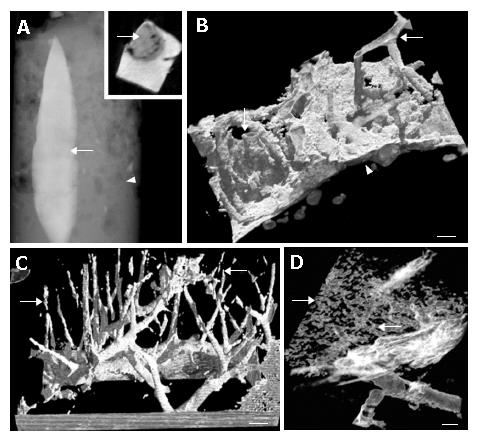
Figure 3 X-ray micro-computed tomography (CT) image set of hepatic tissue.
For detailed recording and subsequent image processing settings we refer to Ananda et al (27). A: Low -magnification data showing an overview of a glutaraldehyde perfused-fixed and subsequently osmium tetroxide/uranyl acetate en bloc stained liver lobule (arrow) versus the unstained sample mounting support (arrowhead). Note, inset shows the corresponding Z-info at an ad random height of the main image; B: X-ray micro CT 3D reconstruction image showing the portal venous blood vessels (arrow) and hepatic tissue (arrowhead); C: X-ray micro CT reconstruction after density histogram image filtering, showing the intricate pattern of hepatic sinusoids (arrow) in 3D context. Note the absence of liver tissue information under this image processing condition (compare with B for the difference); D: Conversely, using different opacity thresholds resulted in the visualization of the hepatic cords, i.e. parenchymal tissue, (arrow). (Courtesy to Ms. S. Ananda and Ms. V. Marsden). Scale Bars (B-D), 500 μm.
- Citation: Braet F, Nagatsuma K, Saito M, Soon L, Wisse E, Matsuura T. The hepatic sinusoidal endothelial lining and colorectal liver metastases. World J Gastroenterol 2007; 13(6): 821-825
- URL: https://www.wjgnet.com/1007-9327/full/v13/i6/821.htm
- DOI: https://dx.doi.org/10.3748/wjg.v13.i6.821


