Copyright
©2007 Baishideng Publishing Group Co.
World J Gastroenterol. Feb 7, 2007; 13(5): 754-760
Published online Feb 7, 2007. doi: 10.3748/wjg.v13.i5.754
Published online Feb 7, 2007. doi: 10.3748/wjg.v13.i5.754
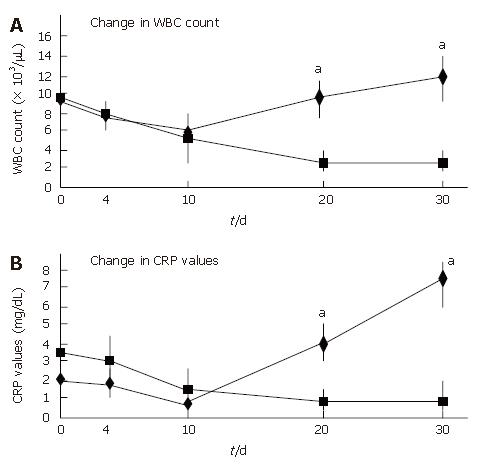
Figure 3 Change in inflammation markers between CMV-positive and CMV-negative UC patients during intravenous CyA treatment.
Panel A showed the change in WBC count. Panel B showed the change in CRP value. The mean values of each group were plotted. Symbols:◆, CMV positive; ■, CMV negative. aP < 0.05.
- Citation: Minami M, Ohta M, Ohkura T, Ando T, Ohmiya N, Niwa Y, Goto H. Cytomegalovirus infection in severe ulcerative colitis patients undergoing continuous intravenous cyclosporine treatment in Japan. World J Gastroenterol 2007; 13(5): 754-760
- URL: https://www.wjgnet.com/1007-9327/full/v13/i5/754.htm
- DOI: https://dx.doi.org/10.3748/wjg.v13.i5.754


