Copyright
©2007 Baishideng Publishing Group Co.
World J Gastroenterol. Dec 28, 2007; 13(48): 6529-6537
Published online Dec 28, 2007. doi: 10.3748/wjg.v13.i48.6529
Published online Dec 28, 2007. doi: 10.3748/wjg.v13.i48.6529
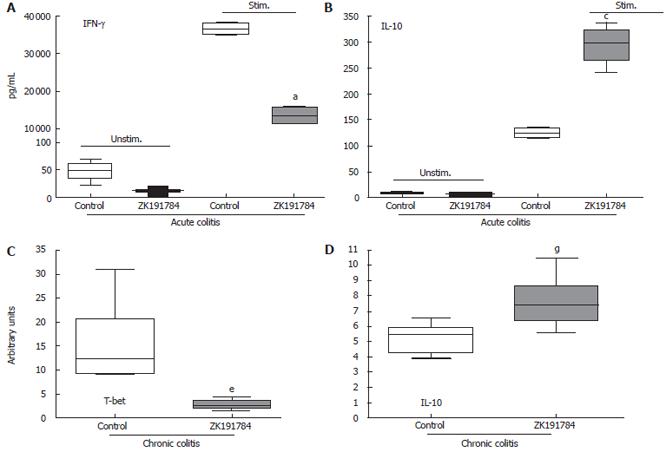
Figure 2 Effects of ZK191784 treatment on cytokine production in acute and chronic colitis.
(A and B) aP < 0.05, cP < 0.05, n = 5 animals. Data presented are representative of three independent experiments. (C and D) n = 8 or 9 animals per group. Data presented show one of two independent experiments. eP < 0.05, gP < 0.05. Data are displayed as box plots, in which the box contains the middle half of the scores in the distribution, the median is shown as a line across the box, and the largest value below the upper hinge and the smallest value above the lower inner fence indicate the distribution.
- Citation: Strauch UG, Obermeier F, Grunwald N, Dunger N, Rath HC, Schölmerich J, Steinmeyer A, Zügel U, Herfarth H. Calcitriol analog ZK191784 ameliorates acute and chronic dextran sodium sulfate-induced colitis by modulation of intestinal dendritic cell numbers and phenotype. World J Gastroenterol 2007; 13(48): 6529-6537
- URL: https://www.wjgnet.com/1007-9327/full/v13/i48/6529.htm
- DOI: https://dx.doi.org/10.3748/wjg.v13.i48.6529


