Copyright
©2007 Baishideng Publishing Group Inc.
World J Gastroenterol. Dec 21, 2007; 13(47): 6410-6413
Published online Dec 21, 2007. doi: 10.3748/wjg.v13.i47.6410
Published online Dec 21, 2007. doi: 10.3748/wjg.v13.i47.6410
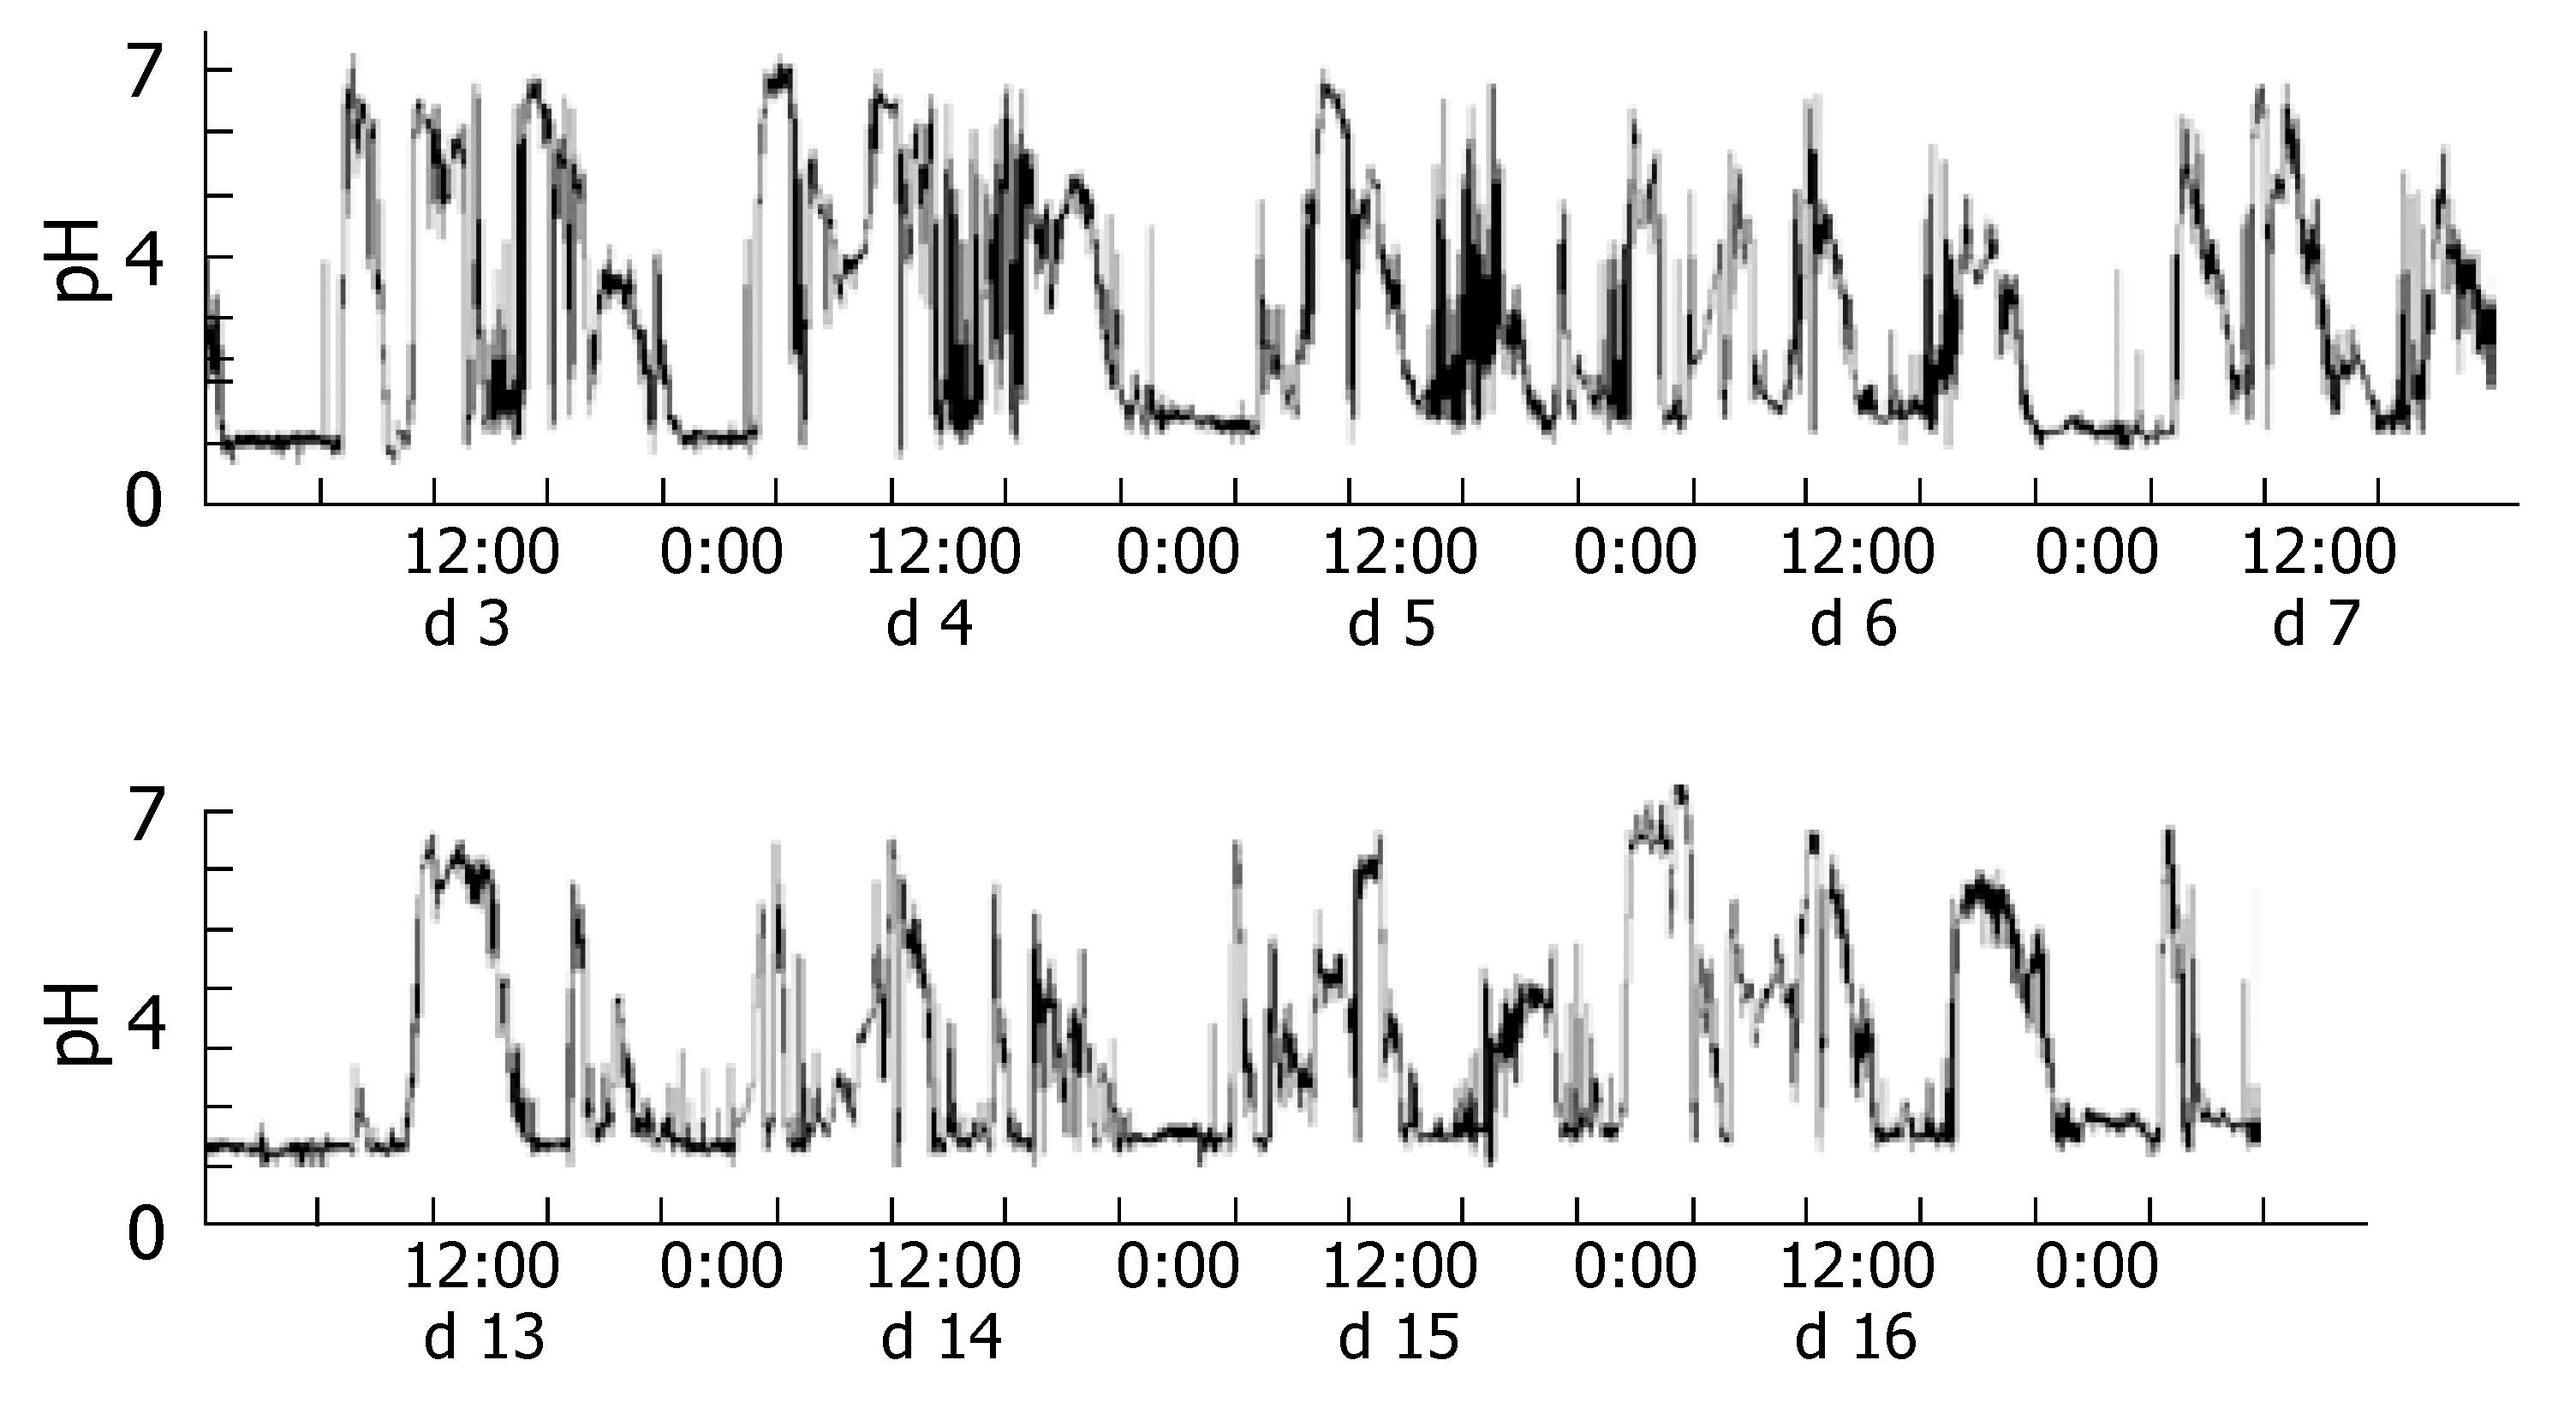
Figure 2 Intragastric pH graph monitored by the Bravo® pH capsule.
The upper graph shows d 3-7 of pH monitoring, and the lower graph shows d 13-16 after placement of the Bravo® capsule in one subject.
- Citation: Ono S, Kato M, Ono Y, Asaka M. New method for long-term monitoring of intragastric pH. World J Gastroenterol 2007; 13(47): 6410-6413
- URL: https://www.wjgnet.com/1007-9327/full/v13/i47/6410.htm
- DOI: https://dx.doi.org/10.3748/wjg.v13.i47.6410


