Copyright
©2007 Baishideng Publishing Group Inc.
World J Gastroenterol. Dec 21, 2007; 13(47): 6356-6364
Published online Dec 21, 2007. doi: 10.3748/wjg.v13.i47.6356
Published online Dec 21, 2007. doi: 10.3748/wjg.v13.i47.6356
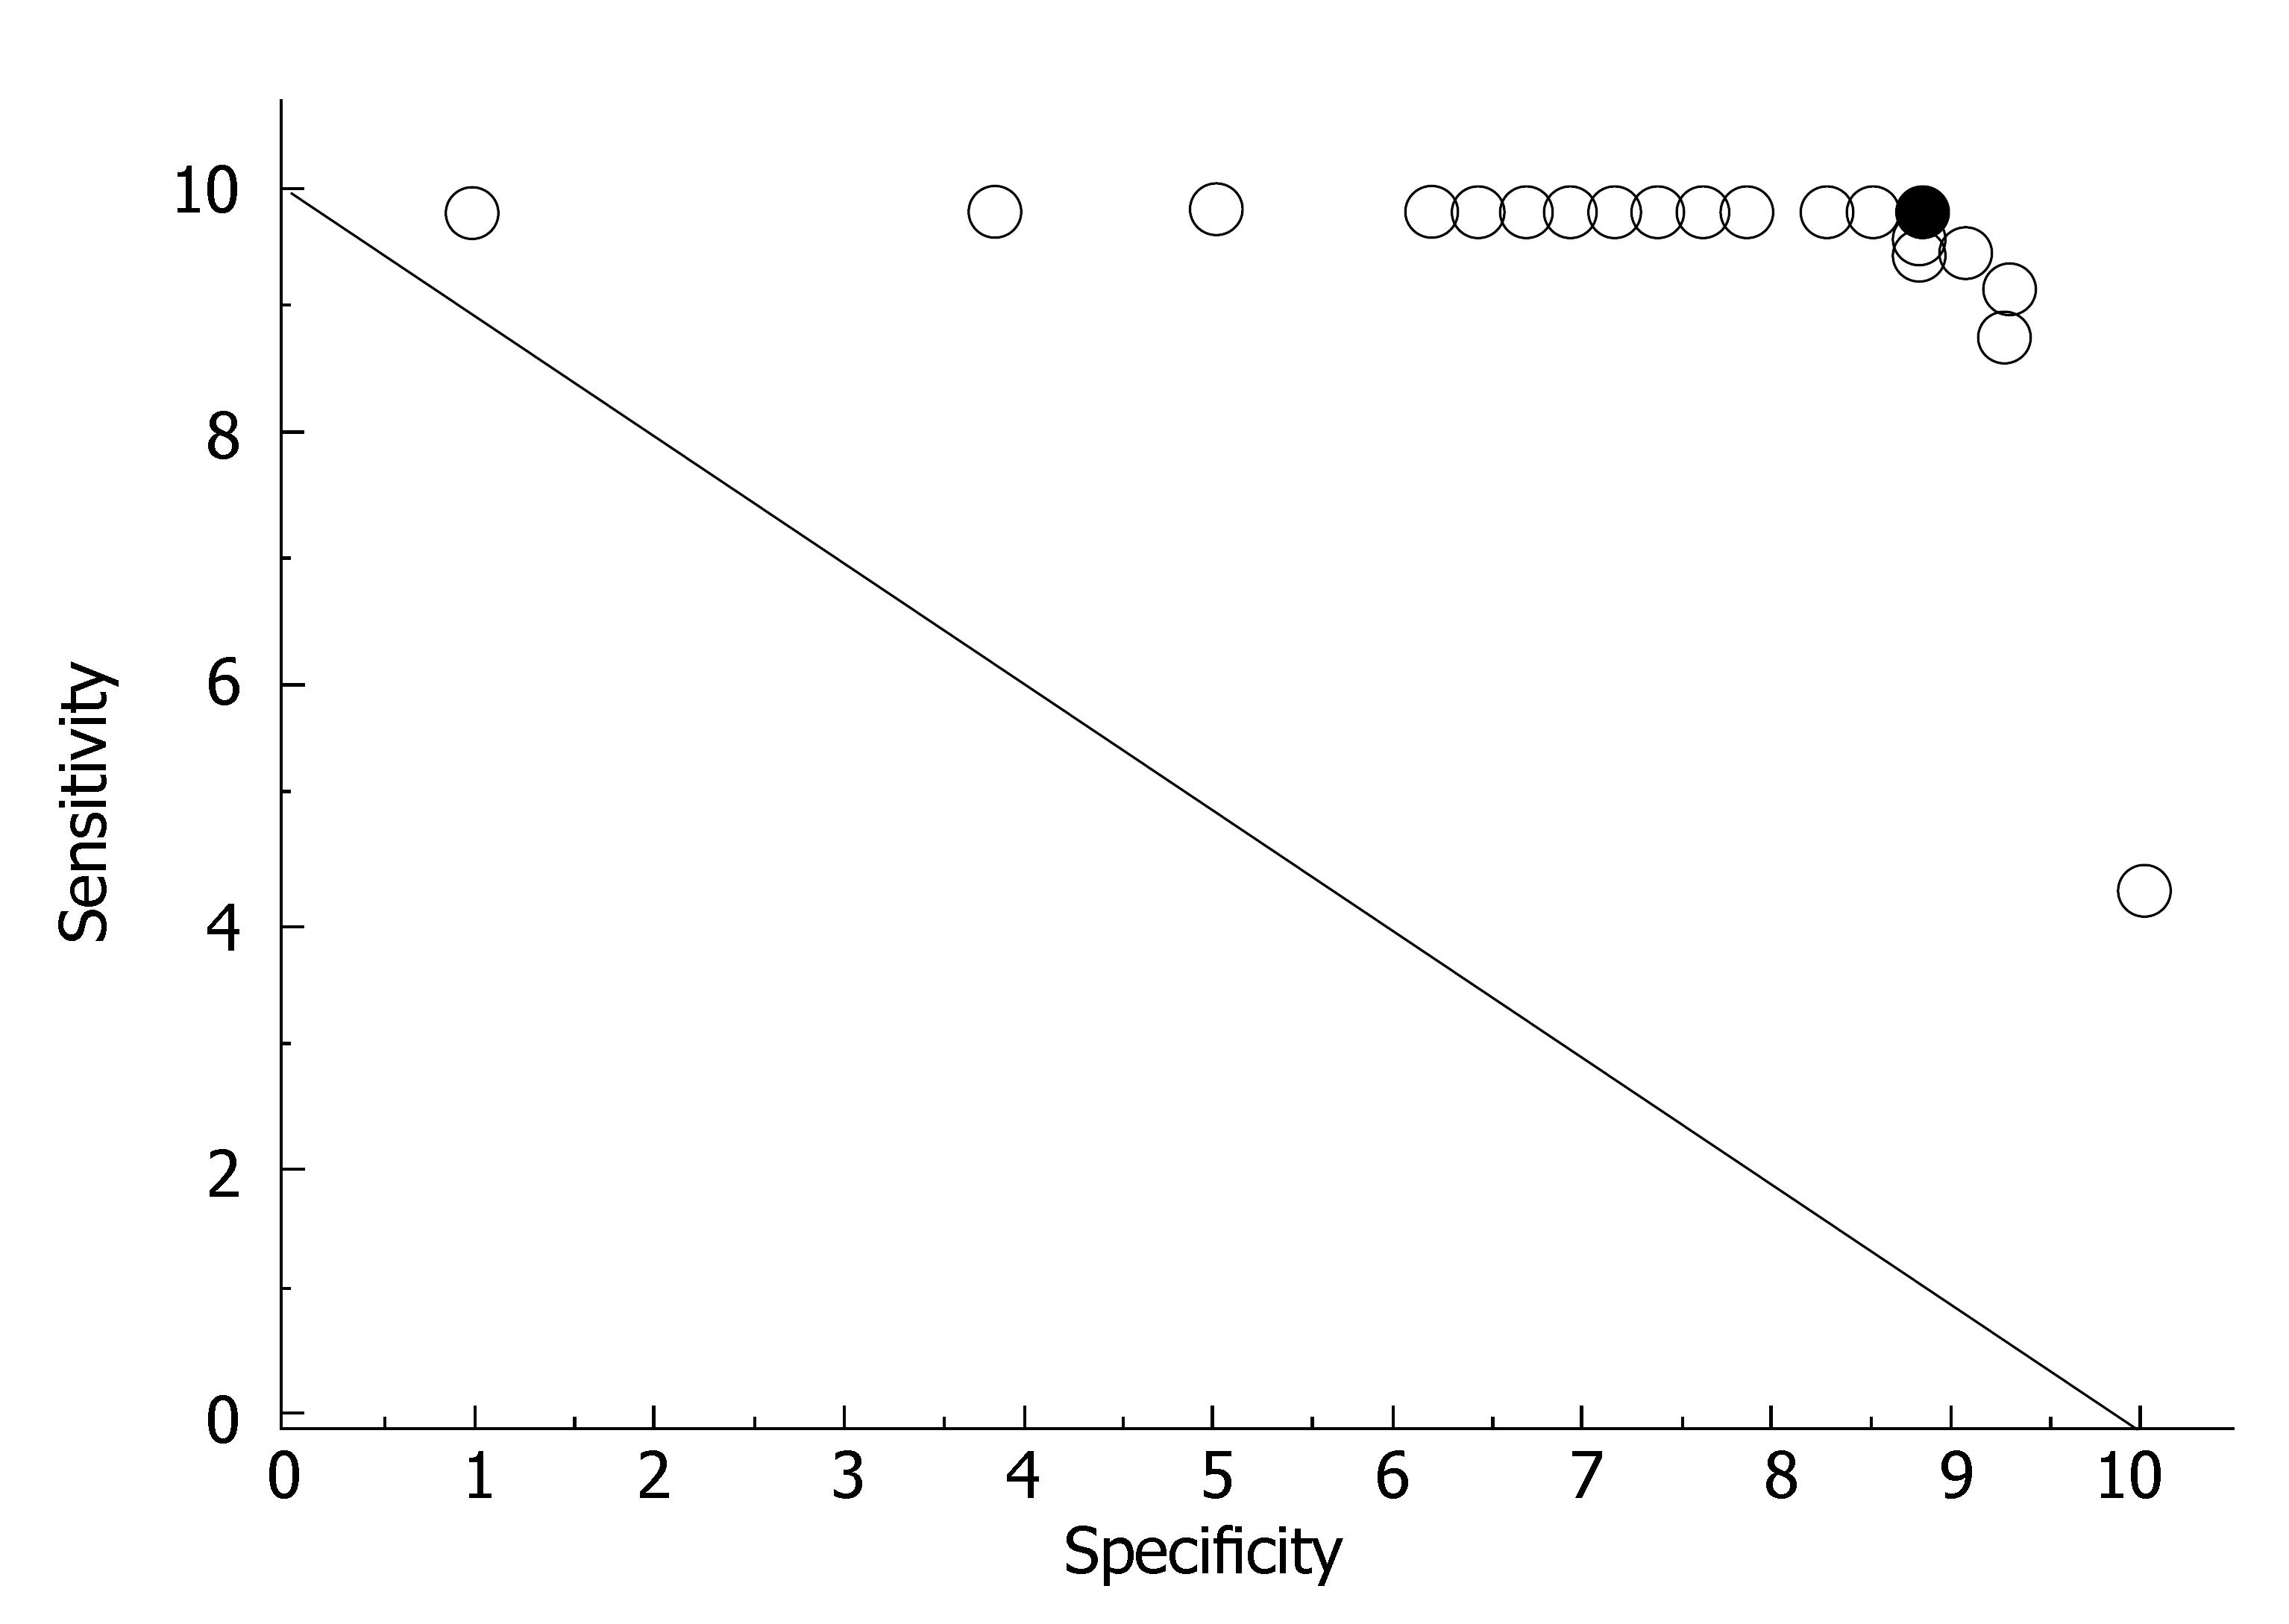
Figure 3 ROC diagram showing the specificity and sensitivity in the late venous phase for different limiting values (varying the cut-off values from +5 to -5).
A greater distance from the diagonal line indicates that a diagnostic test had a higher reliability. The black point in the ROC diagram corresponds to the best sensitivity and specificity.
- Citation: Jung E, Clevert D, Schreyer A, Schmitt S, Rennert J, Kubale R, Feuerbach S, Jung F. Evaluation of quantitative contrast harmonic imaging to assess malignancy of liver tumors: A prospective controlled two-center study. World J Gastroenterol 2007; 13(47): 6356-6364
- URL: https://www.wjgnet.com/1007-9327/full/v13/i47/6356.htm
- DOI: https://dx.doi.org/10.3748/wjg.v13.i47.6356


