Copyright
©2007 Baishideng Publishing Group Co.
World J Gastroenterol. Jan 28, 2007; 13(4): 564-571
Published online Jan 28, 2007. doi: 10.3748/wjg.v13.i4.564
Published online Jan 28, 2007. doi: 10.3748/wjg.v13.i4.564
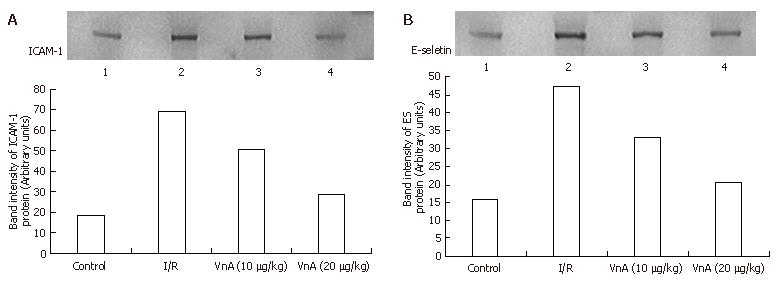
Figure 9 Liver adhesion molecule-1 (ICAM-1) (A) and E-selectin (ES) (B) protein signals of Western blot analyzed with a gel imaging system (Kodak system EDAS120, Japan).
For all groups, n = 10. L1: Control group; L2: I/R group; L3: VnA (10 μg/kg) group; L4: VnA (20 μg/kg) group. Compared with the control group, the signals in I/R group increased and weakened in the VnA pretreated group in a dose-dependent manner.
-
Citation: Wang ZZ, Zhao WJ, Zhang XS, Tian XF, Wang YZ, Zhang F, Yuan JC, Han GZ, Liu KX, Yao JH. Protection of
Veratrum nigrum L. var. ussuriense Nakai alkaloids against ischemia-reperfusion injury of the rat liver. World J Gastroenterol 2007; 13(4): 564-571 - URL: https://www.wjgnet.com/1007-9327/full/v13/i4/564.htm
- DOI: https://dx.doi.org/10.3748/wjg.v13.i4.564


