Copyright
©2007 Baishideng Publishing Group Co.
World J Gastroenterol. Jan 28, 2007; 13(4): 564-571
Published online Jan 28, 2007. doi: 10.3748/wjg.v13.i4.564
Published online Jan 28, 2007. doi: 10.3748/wjg.v13.i4.564
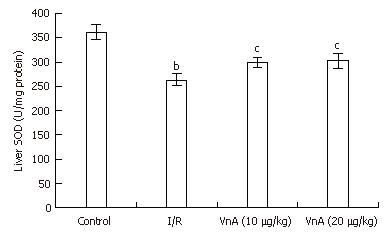
Figure 3 Activity of superoxide dismutase (SOD) in the liver tissue in different groups (mean ± SD, n = 10).
After 90 min of ischemia and 4 h of reperfusion, the liver tissue was homogenized and assayed for SOD levels with an SOD assay kit as the index of hepatic oxidative stress. bP < 0.01 vs control group; cP < 0.05 vs I/R group.
-
Citation: Wang ZZ, Zhao WJ, Zhang XS, Tian XF, Wang YZ, Zhang F, Yuan JC, Han GZ, Liu KX, Yao JH. Protection of
Veratrum nigrum L. var. ussuriense Nakai alkaloids against ischemia-reperfusion injury of the rat liver. World J Gastroenterol 2007; 13(4): 564-571 - URL: https://www.wjgnet.com/1007-9327/full/v13/i4/564.htm
- DOI: https://dx.doi.org/10.3748/wjg.v13.i4.564


