Copyright
©2007 Baishideng Publishing Group Inc.
World J Gastroenterol. Oct 21, 2007; 13(39): 5245-5252
Published online Oct 21, 2007. doi: 10.3748/wjg.v13.i39.5245
Published online Oct 21, 2007. doi: 10.3748/wjg.v13.i39.5245
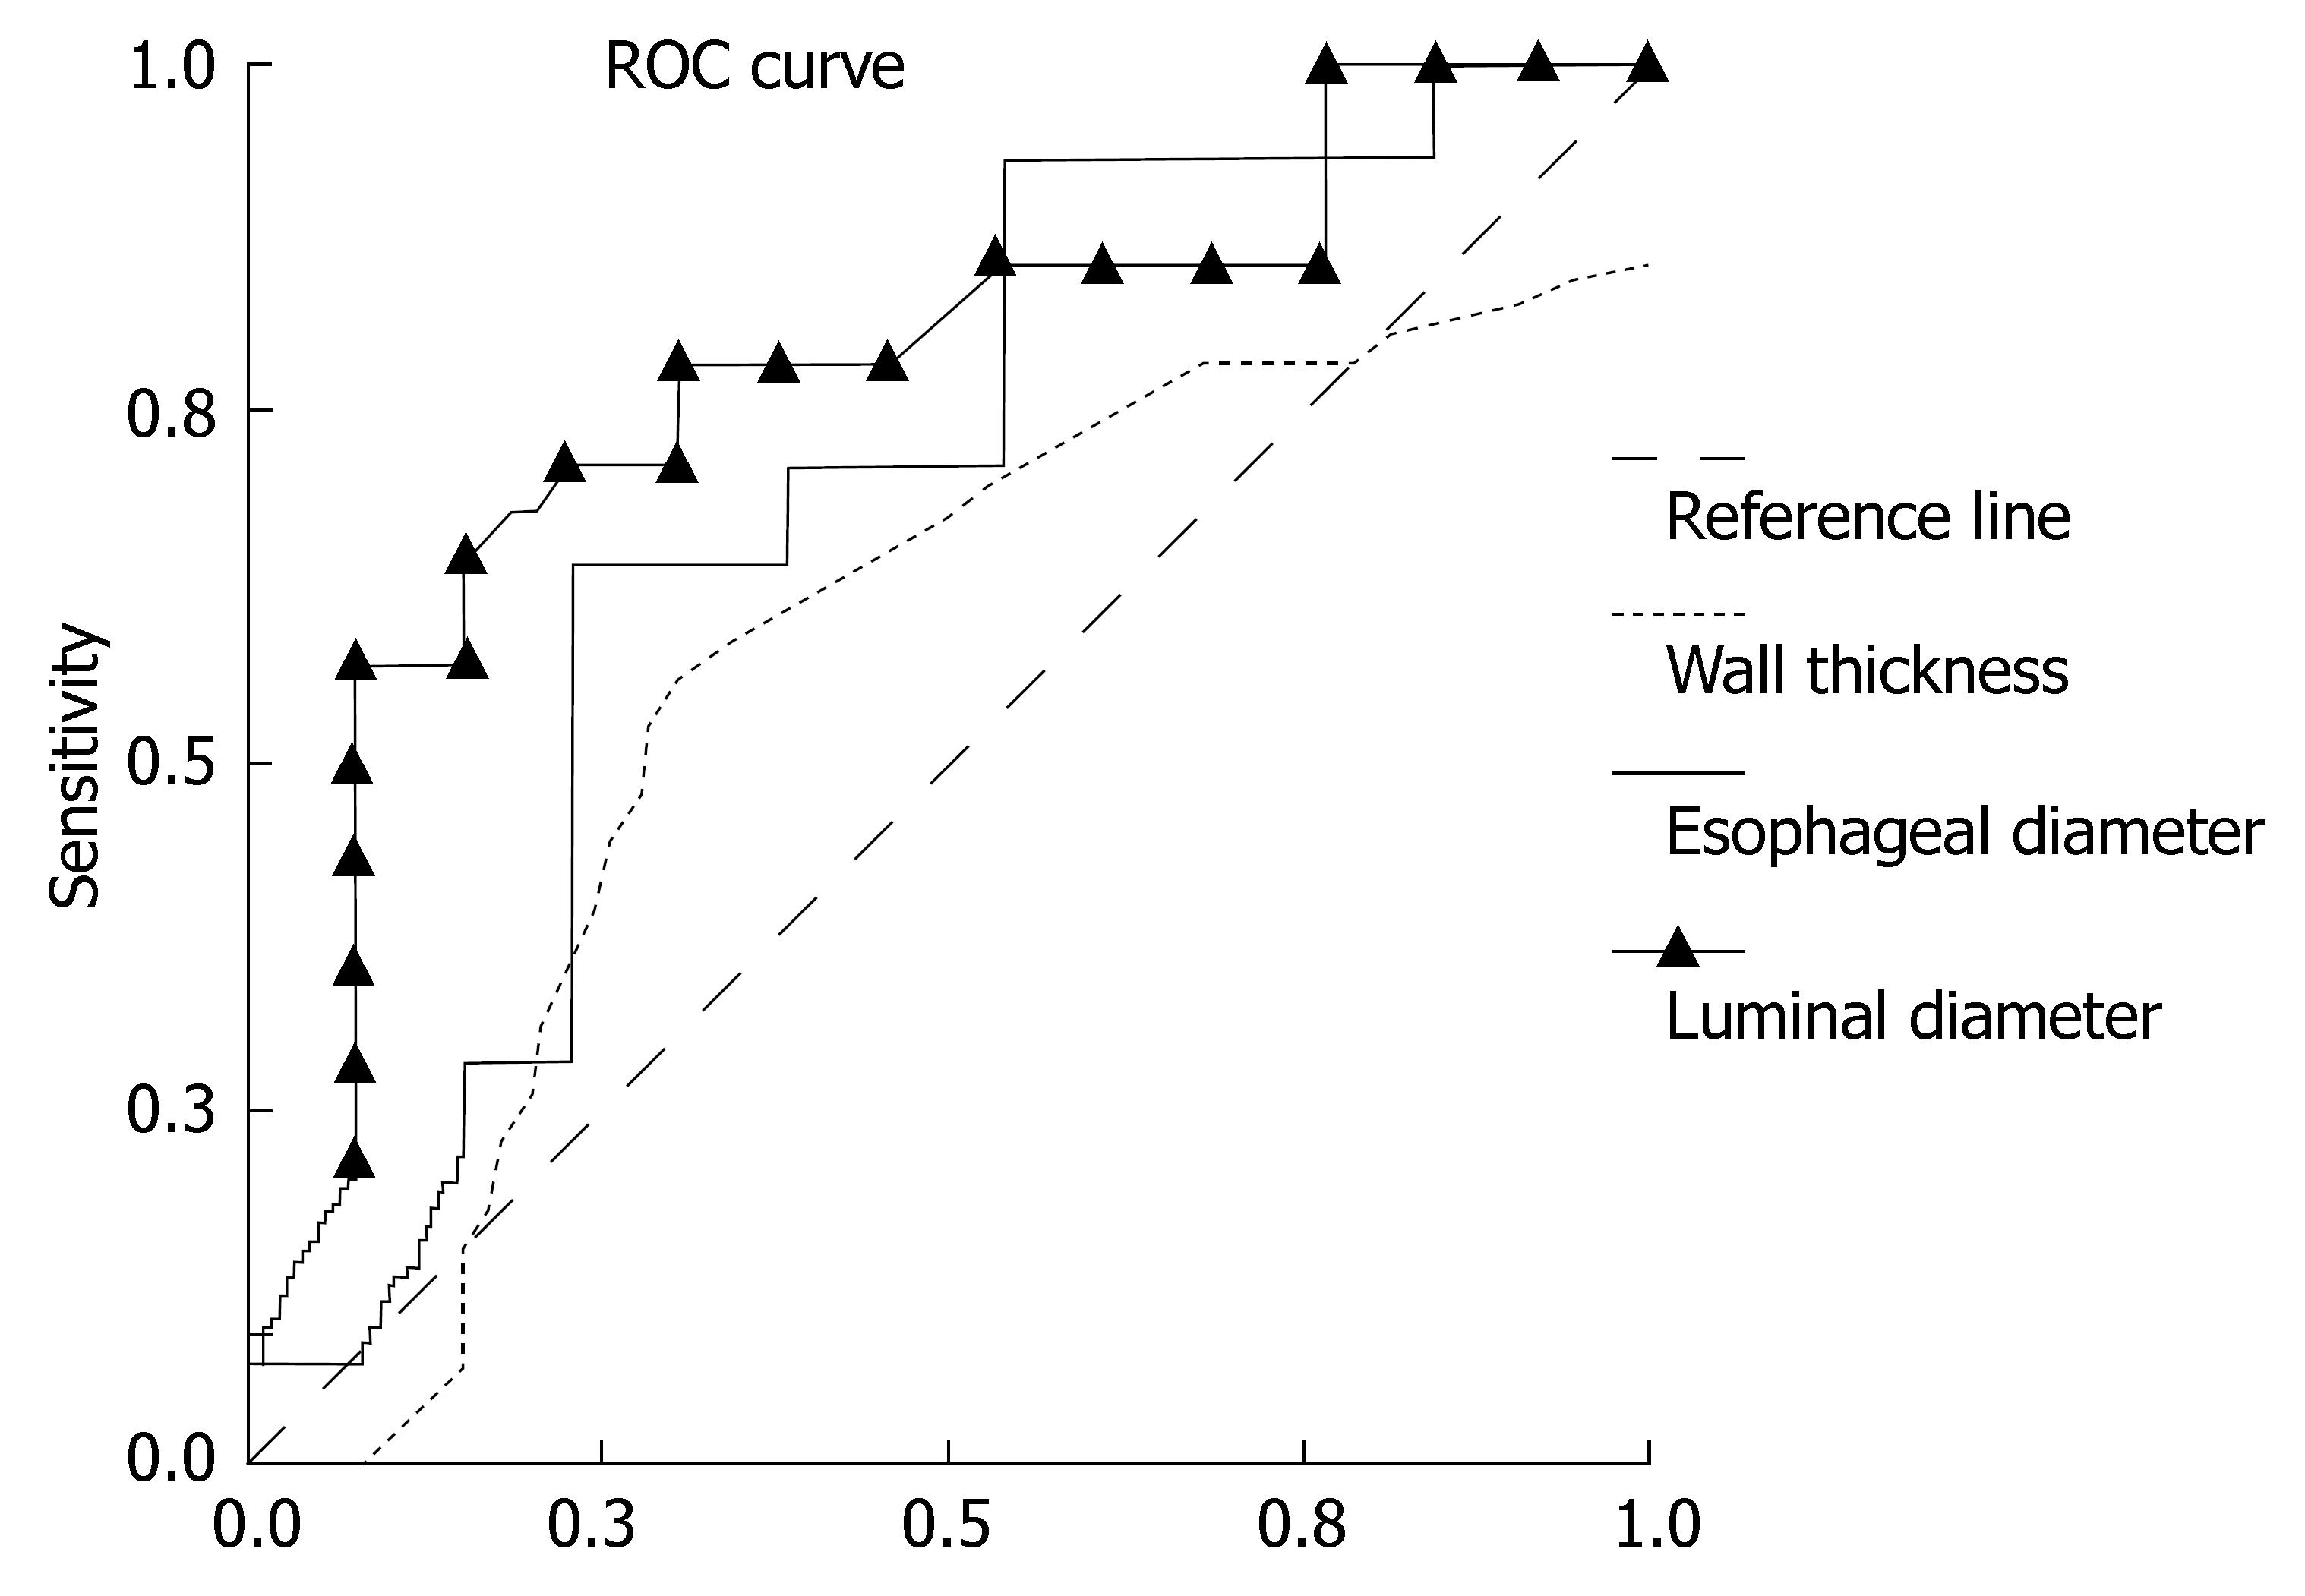
Figure 2 The ROC curve showing the relation between TCEUS findings according to total PR group (B + D) (n = 14) and reflux-negative group (E) (n = 13) (AUC = 0.
775, P = 0.015 for ELD). PR: Isolated proximal reflux; ELD: Esophageal luminal diameter.
- Citation: Kacar S, Uysal S, Kuran S, Dagli U, Ozin Y, Karabulut E, Sasmaz N. Transcutaneous cervical esophagus ultrasound in adults: Relation with ambulatory 24-h pH-monitoring and esophageal manometry. World J Gastroenterol 2007; 13(39): 5245-5252
- URL: https://www.wjgnet.com/1007-9327/full/v13/i39/5245.htm
- DOI: https://dx.doi.org/10.3748/wjg.v13.i39.5245


