Copyright
©2007 Baishideng Publishing Group Co.
World J Gastroenterol. Oct 14, 2007; 13(38): 5090-5095
Published online Oct 14, 2007. doi: 10.3748/wjg.v13.i38.5090
Published online Oct 14, 2007. doi: 10.3748/wjg.v13.i38.5090
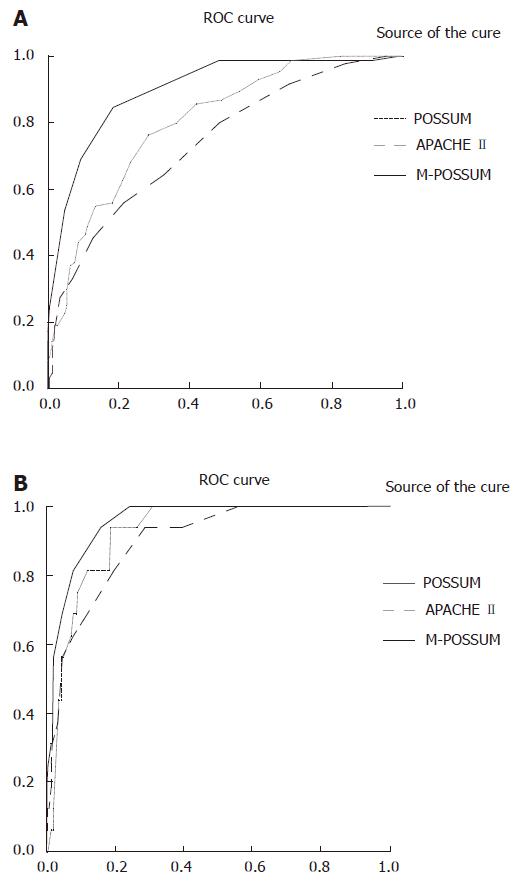
Figure 2 ROC curve of postoperative complications (A) and mortality (B).
The red curve (M-POSSUM) covers the biggest area (× 100%) and illustrates the accuracy of M-POSSUM predicting the morbidity of post-operation before operation.
- Citation: Ding LA, Sun LQ, Chen SX, Qu LL, Xie DF. Modified physiological and operative score for the enumeration of mortality and morbidity risk assessment model in general surgery. World J Gastroenterol 2007; 13(38): 5090-5095
- URL: https://www.wjgnet.com/1007-9327/full/v13/i38/5090.htm
- DOI: https://dx.doi.org/10.3748/wjg.v13.i38.5090


