Copyright
©2007 Baishideng Publishing Group Co.
World J Gastroenterol. Oct 14, 2007; 13(38): 5065-5070
Published online Oct 14, 2007. doi: 10.3748/wjg.v13.i38.5065
Published online Oct 14, 2007. doi: 10.3748/wjg.v13.i38.5065
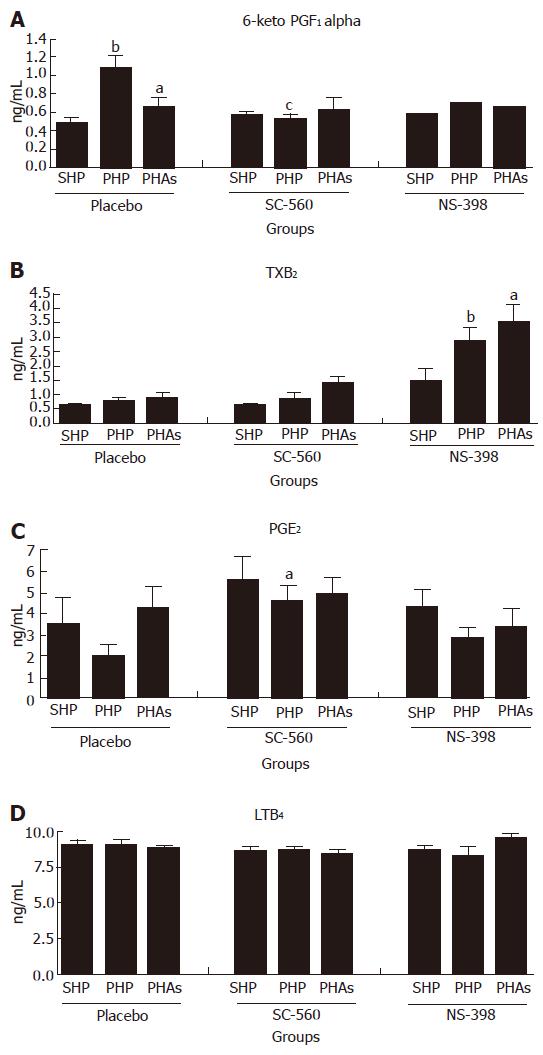
Figure 3 A: Plasmatic 6-keto PGF1α concentrations (expressed in ng/mL): bP < 0.
01 vs ShP (placebo); aP < 0.05 vs PHP (placebo); cP < 0.05 vs PHP (placebo); B: Plasmatic TXB2 concentrations (expressed in ng/mL): bP < 0.001 vs PHP (placebo); aP < 0.05 vs ShP (NS-398) and P < 0.001 vs PHAs (placebo); C: Plasmatic PGE2 concentrations (expressed in ng/mL): aP < 0.05 vs PHP (placebo); D: Plasmatic LTB4 concentrations (expressed in ng/mL).
- Citation: Eizayaga FX, Aguejouf O, Desplat V, Belon P, Doutremepuich C. Modifications produced by selective inhibitors of cyclooxygenase and ultra low dose aspirin on platelet activity in portal hypertension. World J Gastroenterol 2007; 13(38): 5065-5070
- URL: https://www.wjgnet.com/1007-9327/full/v13/i38/5065.htm
- DOI: https://dx.doi.org/10.3748/wjg.v13.i38.5065


