Copyright
©2007 Baishideng Publishing Group Co.
World J Gastroenterol. Oct 7, 2007; 13(37): 4986-4995
Published online Oct 7, 2007. doi: 10.3748/wjg.v13.i37.4986
Published online Oct 7, 2007. doi: 10.3748/wjg.v13.i37.4986
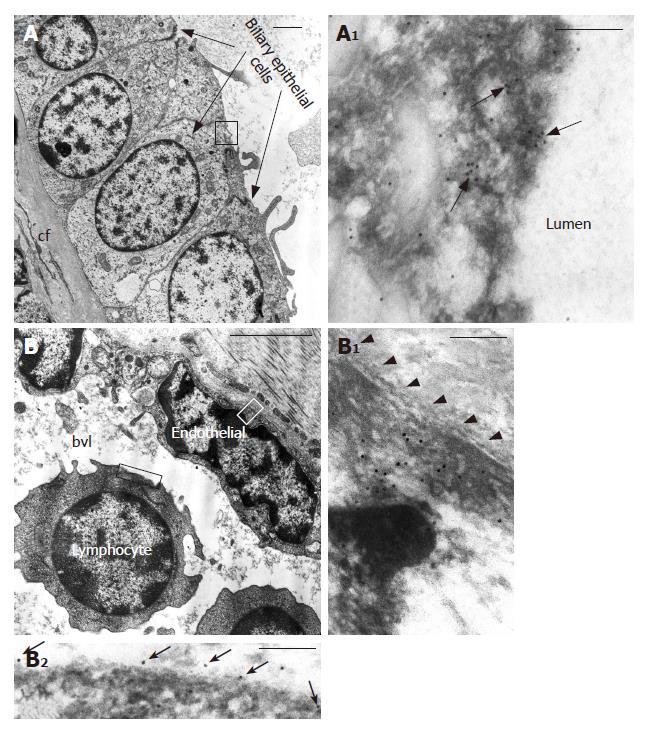
Figure 8 TrkANGF distribution in cirrhotic tissue from patient with HCC by immunogold labeling.
A, A1: Transmission electron micrographs of biliary epithelial cells showing positive immunogold reaction on cell membrane and cytoplasmic vesicles (black arrows) near the ductal lumen; B: Transmission electron micrographs of endothelial cells and lymphocytes; B1: Immunoreactivity free in the cytoplasm of endothelial cells beneath the cell membrane (arrowheads); B2: Gold particles on cell membrane of a lymphocyte. In A1, B1 and B2 details at higher magnification are shown. bvl: blood vessel lumen; cf: collagen fibers. Scale bars = A, B: 2 μm; A1, B1, B2: 200 nm.
- Citation: Rasi G, Serafino A, Bellis L, Lonardo MT, Andreola F, Zonfrillo M, Vennarecci G, Pierimarchi P, Vallebona PS, Ettorre GM, Santoro E, Puoti C. Nerve growth factor involvement in liver cirrhosis and hepatocellular carcinoma. World J Gastroenterol 2007; 13(37): 4986-4995
- URL: https://www.wjgnet.com/1007-9327/full/v13/i37/4986.htm
- DOI: https://dx.doi.org/10.3748/wjg.v13.i37.4986


