Copyright
©2007 Baishideng Publishing Group Co.
World J Gastroenterol. Oct 7, 2007; 13(37): 4986-4995
Published online Oct 7, 2007. doi: 10.3748/wjg.v13.i37.4986
Published online Oct 7, 2007. doi: 10.3748/wjg.v13.i37.4986
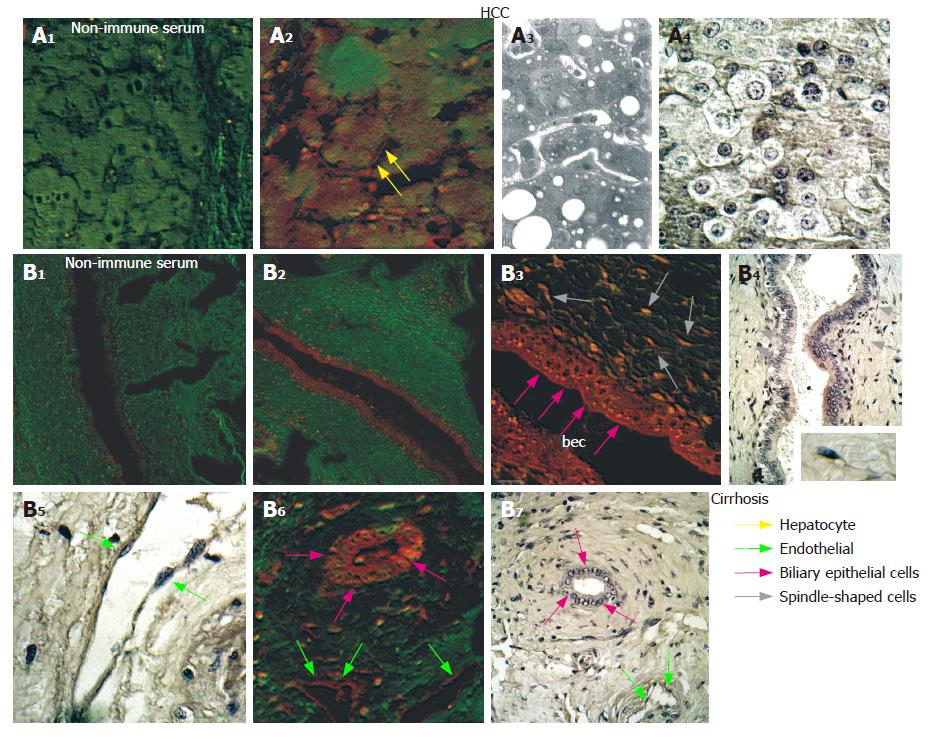
Figure 7 TrkANGF distribution in HCC and cirrhotic tissues.
A: HCC tissue; B: Cirrhotic tissue. A1, A2, B1, B2, B3, B6: Confocal microscopy images of immuno-stained sections. No immunoreaction was observed in controls performed by substitution of primary antisera with non-immune rabbit serum; A4, B4, B5, B7: Images of HE stained sections; A3: Images of semithin section from samples embedded in Spurr epoxy resin. Differently coloured arrows indicate the different cell types (see legend). bec: biliary epithelial cells.
- Citation: Rasi G, Serafino A, Bellis L, Lonardo MT, Andreola F, Zonfrillo M, Vennarecci G, Pierimarchi P, Vallebona PS, Ettorre GM, Santoro E, Puoti C. Nerve growth factor involvement in liver cirrhosis and hepatocellular carcinoma. World J Gastroenterol 2007; 13(37): 4986-4995
- URL: https://www.wjgnet.com/1007-9327/full/v13/i37/4986.htm
- DOI: https://dx.doi.org/10.3748/wjg.v13.i37.4986


