Copyright
©2007 Baishideng Publishing Group Co.
World J Gastroenterol. Oct 7, 2007; 13(37): 4986-4995
Published online Oct 7, 2007. doi: 10.3748/wjg.v13.i37.4986
Published online Oct 7, 2007. doi: 10.3748/wjg.v13.i37.4986
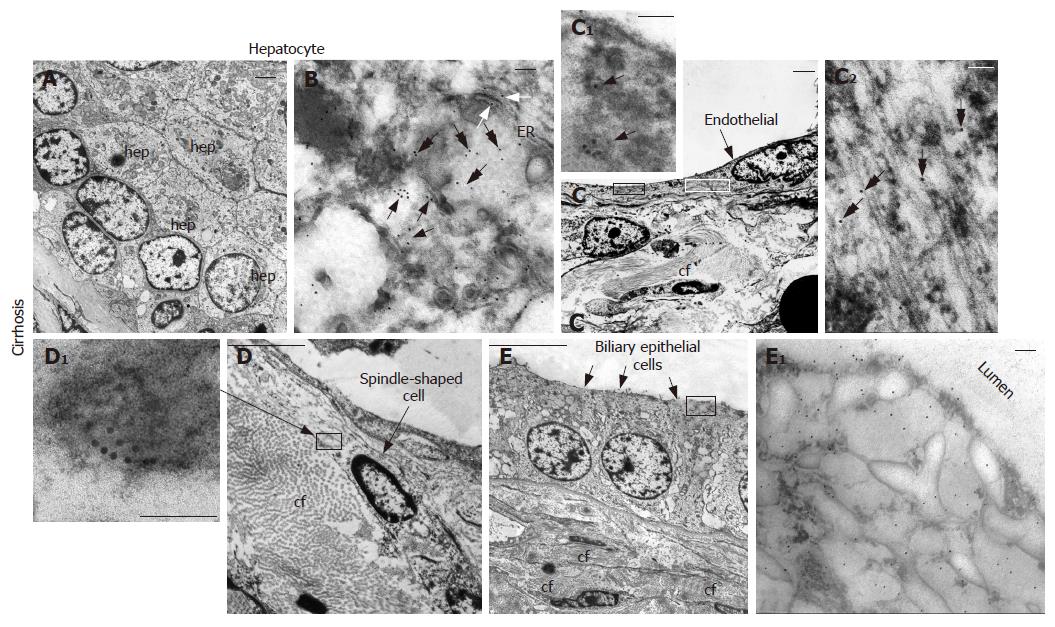
Figure 6 NGF distribution in cirrhotic tissue from patient with HCC by immunogold labelling.
A, B: Transmission electron micrographs of hepatocytes showing positive immunogold reaction on cytoplasmic vesicles (black arrows), free in the cytoplasm (double pointed arrows) and along endoplasmic reticulum (white arrows); C, C1, C2: Endothelial cells; positive immunogold reaction on cytoplasmic vesicles (black arrows) and free in the cytoplasm (double pointed arrows); D, D1: Spindle-shaped cells; E, D1: Biliary epithelial cells. In C1, C2, D1 and E1 details at higher magnification are shown. hep: hepatocytes; cf: collagen fibers; ER: endoplasmic reticulum. Scale bars = A, C, D, E: 2 μm; B, C1, C2, D1, E1: 100 nm.
- Citation: Rasi G, Serafino A, Bellis L, Lonardo MT, Andreola F, Zonfrillo M, Vennarecci G, Pierimarchi P, Vallebona PS, Ettorre GM, Santoro E, Puoti C. Nerve growth factor involvement in liver cirrhosis and hepatocellular carcinoma. World J Gastroenterol 2007; 13(37): 4986-4995
- URL: https://www.wjgnet.com/1007-9327/full/v13/i37/4986.htm
- DOI: https://dx.doi.org/10.3748/wjg.v13.i37.4986


