Copyright
©2007 Baishideng Publishing Group Co.
World J Gastroenterol. Sep 14, 2007; 13(34): 4593-4597
Published online Sep 14, 2007. doi: 10.3748/wjg.v13.i34.4593
Published online Sep 14, 2007. doi: 10.3748/wjg.v13.i34.4593
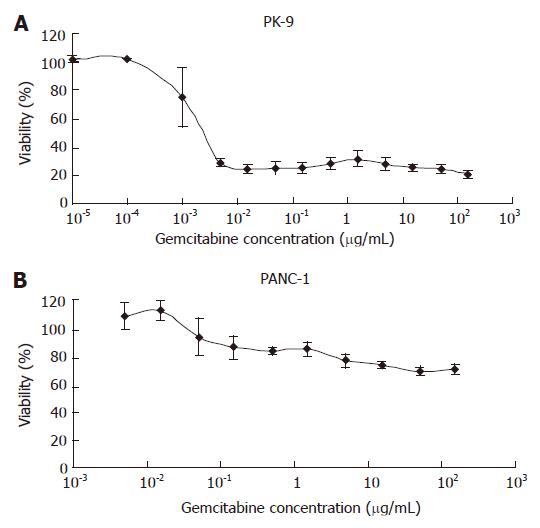
Figure 1 Response to gemcitabine in pancreatic cancer cell lines.
Dose-response curves for gemcitabine in PK-9 (A) and PANC-1 (B). These are representative gemcitabine-sensitive and -resistant cell lines, respectively. Each bar represent a standard deviation (SD).
- Citation: Ishida M, Sunamura M, Furukawa T, Akada M, Fujimura H, Shibuya E, Egawa S, Unno M, Horii A. Elucidation of the relationship of BNIP3 expression to gemcitabine chemosensitivity and prognosis. World J Gastroenterol 2007; 13(34): 4593-4597
- URL: https://www.wjgnet.com/1007-9327/full/v13/i34/4593.htm
- DOI: https://dx.doi.org/10.3748/wjg.v13.i34.4593


