Copyright
©2007 Baishideng Publishing Group Co.
World J Gastroenterol. Sep 7, 2007; 13(33): 4504-4508
Published online Sep 7, 2007. doi: 10.3748/wjg.v13.i33.4504
Published online Sep 7, 2007. doi: 10.3748/wjg.v13.i33.4504
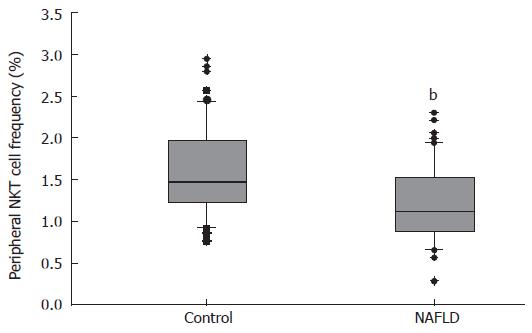
Figure 1 Frequency of peripheral NKT cells in NAFLD patients versus healthy controls.
Boxes show values within 25th and 75th percentiles, horizontal bar represents the median, 80% of values are between the extremities of vertical bars (10th-90th percentiles), and extreme values are represented by individual symbols. bP < 0.001 vs healthy controls.
- Citation: Xu CF, Yu CH, Li YM, Xu L, Du J, Shen Z. Association of the frequency of peripheral natural killer T cells with nonalcoholic fatty liver disease. World J Gastroenterol 2007; 13(33): 4504-4508
- URL: https://www.wjgnet.com/1007-9327/full/v13/i33/4504.htm
- DOI: https://dx.doi.org/10.3748/wjg.v13.i33.4504


