Copyright
©2007 Baishideng Publishing Group Co.
World J Gastroenterol. Aug 28, 2007; 13(32): 4328-4332
Published online Aug 28, 2007. doi: 10.3748/wjg.v13.i32.4328
Published online Aug 28, 2007. doi: 10.3748/wjg.v13.i32.4328
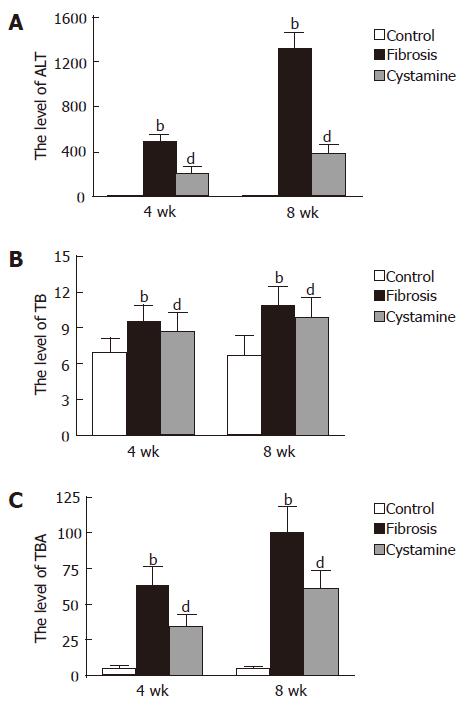
Figure 2 Hepatic function changes of each group.
A: the level of ALT after Cystamine treatment; B: the level of TB after Cystamine treatment; C: the level of TBA after Cystamine treatment. bP < 0.01 vs Control; dP < 0.01 vs Fibrosis.
-
Citation: Qiu JF, Zhang ZQ, Chen W, Wu ZY. Cystamine ameliorates liver fibrosis induced by carbon tetrachloride
via inhibition of tissue transglutaminase. World J Gastroenterol 2007; 13(32): 4328-4332 - URL: https://www.wjgnet.com/1007-9327/full/v13/i32/4328.htm
- DOI: https://dx.doi.org/10.3748/wjg.v13.i32.4328


