Copyright
©2007 Baishideng Publishing Group Co.
World J Gastroenterol. Aug 21, 2007; 13(31): 4192-4198
Published online Aug 21, 2007. doi: 10.3748/wjg.v13.i31.4192
Published online Aug 21, 2007. doi: 10.3748/wjg.v13.i31.4192
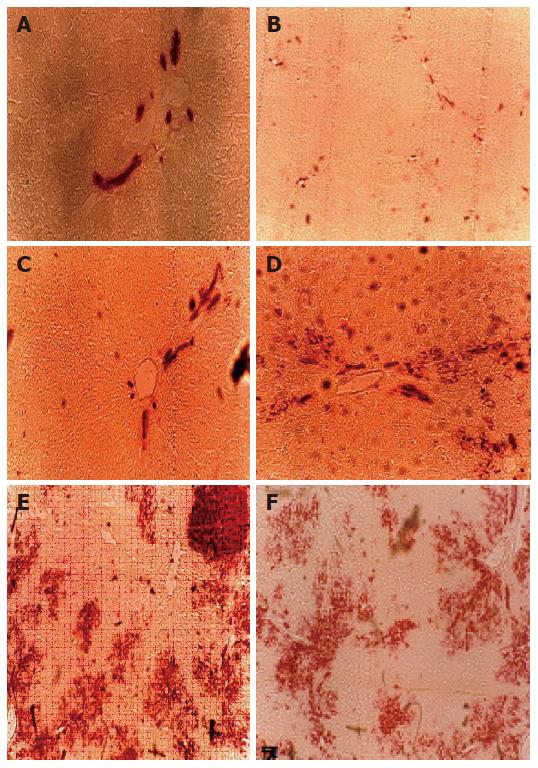
Figure 1 GTase expression in liver sections from the normal control group (A), treated group with PH (removed the greater part liver of rat alone) (B), Huqi San- given group one week before preparation of mode rats (C), large dose therapeutic group (8 g/kg body weight) (D), model group (DEN + 2-AAF + PH) (E) and small dose therapeutic group (4 g/kg body weight) (F).
The red stained areas are the -GTase positive foci with various sizes.
- Citation: Li X, Shi ZM, Feng P, Wen ZY, Wang XJ. Effect of Qi-protecting powder (Huqi San) on expression of c-jun, c-fos and c-myc in diethylnitrosamine-mediated hepatocarcinogenesis. World J Gastroenterol 2007; 13(31): 4192-4198
- URL: https://www.wjgnet.com/1007-9327/full/v13/i31/4192.htm
- DOI: https://dx.doi.org/10.3748/wjg.v13.i31.4192


