Copyright
©2007 Baishideng Publishing Group Co.
World J Gastroenterol. Jan 21, 2007; 13(3): 383-390
Published online Jan 21, 2007. doi: 10.3748/wjg.v13.i3.383
Published online Jan 21, 2007. doi: 10.3748/wjg.v13.i3.383
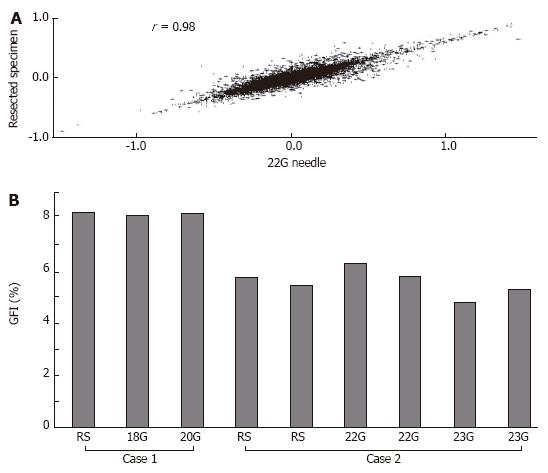
Figure 6 Gene-expression correlation between surgical resection and 22-guage needle liver biopsy specimens from the same patient.
Intensity data were plotted and the correlation coefficient calculated by the Rosetta Luminator system v2.0 (A). The GFI values of resected and biopsy specimens were determined using the same formula based on the 4 marker clones (B). RS: Resected specimen.
- Citation: Utsunomiya T, Okamoto M, Wakiyama S, Hashimoto M, Fukuzawa K, Ezaki T, Aishima S, Yoshikawa Y, Hanai T, Inoue H, Barnard GF, Mori M. A specific gene-expression signature quantifies the degree of hepatic fibrosis in patients with chronic liver disease. World J Gastroenterol 2007; 13(3): 383-390
- URL: https://www.wjgnet.com/1007-9327/full/v13/i3/383.htm
- DOI: https://dx.doi.org/10.3748/wjg.v13.i3.383


