Copyright
©2007 Baishideng Publishing Group Co.
World J Gastroenterol. Jan 21, 2007; 13(3): 378-382
Published online Jan 21, 2007. doi: 10.3748/wjg.v13.i3.378
Published online Jan 21, 2007. doi: 10.3748/wjg.v13.i3.378
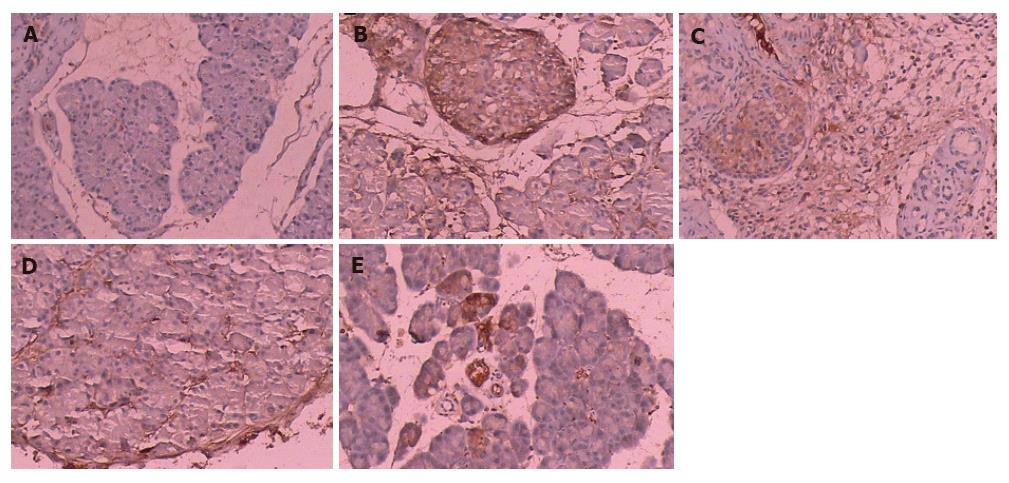
Figure 2 Pancreatic immunochemistry changes in normal group (A), control group (B) and 20 mg/kg (C), 40 mg/kg (D) and 80 mg/kg (E) emodin-treated groups (× 100).
Normal group had no TGF-β1 expression (brown color reaction), control group had the highest expression of TGF-β1 while 20, 40 and 80 mg/kg emodin-treated groups had different levels of TGF-β1 expression.
- Citation: Wang CH, Gao ZQ, Ye B, Cai JT, Xie CG, Qian KD, Du Q. Effect of emodin on pancreatic fibrosis in rats. World J Gastroenterol 2007; 13(3): 378-382
- URL: https://www.wjgnet.com/1007-9327/full/v13/i3/378.htm
- DOI: https://dx.doi.org/10.3748/wjg.v13.i3.378


