Copyright
©2007 Baishideng Publishing Group Co.
World J Gastroenterol. Jan 21, 2007; 13(3): 369-377
Published online Jan 21, 2007. doi: 10.3748/wjg.v13.i3.369
Published online Jan 21, 2007. doi: 10.3748/wjg.v13.i3.369
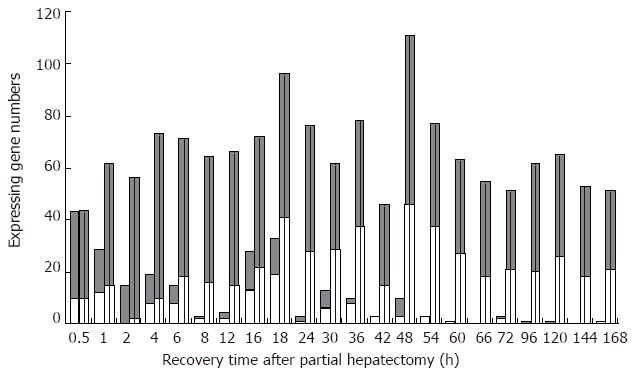
Figure 2 The initial and total expression profiles of 239 inflammatory response-associated genes at each time point of liver regeneration.
Grey bars: Up-regulated gene; White bars: Down-regulated. Blank bars represent initial expressing genes, in which up-regulated genes were predominant in the forepart, and the down-regulated in the prophase and metaphase, whereas very few in the anaphase. Dotted bars represent the total expressing genes, in which some genes were up-regulated, and the others down-regulated during the whole LR.
- Citation: Shao HY, Zhao LF, Xu CS. Expression patterns and action analysis of genes associated with inflammatory responses during rat liver regeneration. World J Gastroenterol 2007; 13(3): 369-377
- URL: https://www.wjgnet.com/1007-9327/full/v13/i3/369.htm
- DOI: https://dx.doi.org/10.3748/wjg.v13.i3.369


