Copyright
©2007 Baishideng Publishing Group Co.
World J Gastroenterol. Jul 28, 2007; 13(28): 3841-3846
Published online Jul 28, 2007. doi: 10.3748/wjg.v13.i28.3841
Published online Jul 28, 2007. doi: 10.3748/wjg.v13.i28.3841
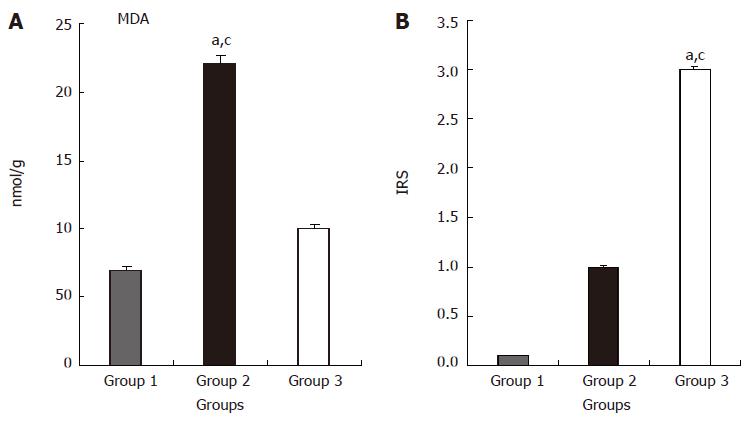
Figure 2 Effects of ischemia/reperfusion and L-Arg on MDA levels (A) and IRS (B) of liver tissue.
aP < 0.05 group 2 vs group 1; cP < 0.05 group 2 vs group 3. Values are expressed as mean ± SE, MDA; Malondialdehyde. IRS; Immunoreactivity scores, Group 1 (n = 10), Sham-control group; Group 2 (n = 10), I/R-untreated group; Group 3 (n = 10), I/R-L-Arg group.
- Citation: Tuncer MC, Ozturk H, Buyukbayram H, Ozturk H. Interaction of L-Arginine-methyl ester and Sonic hedgehog in liver ischemia-reperfusion injury in the rats. World J Gastroenterol 2007; 13(28): 3841-3846
- URL: https://www.wjgnet.com/1007-9327/full/v13/i28/3841.htm
- DOI: https://dx.doi.org/10.3748/wjg.v13.i28.3841


